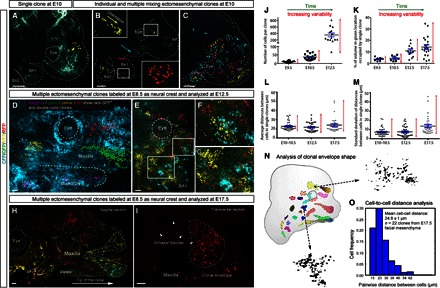
Fig. 1. Size, shape, and distribution of neural crest–derived ectomesenchymal clones.

(A to C) Genetic tracing of neural crest cells and their progenies induced at E8.5 in Sox10-CreERT2/R26Confetti embryos and analyzed at E9.5 to E10. (A) Head of the E10 embryo with single YFP+ ectomesenchymal clone. Note the compact structure of the clone. (B) Multiple separated clones in different regions of embryo face. Yellow and blue arrowheads show the orientation of cellular groups. (C) Example of multiple overlapping clones in the early developing face. Note the intense local clonal mixing. (D to I) Genetic tracing of neural crest cells and their progenies induced at E8.5 in PLP-CreERT2/R26Confetti embryos and analyzed at E12.5. (D) Reconstruction of rare (RFP+CFP, YFP+CFP, RFP+YFP, and GFP-expressing) individual clones in the facial region of an E12.5 embryo. Note that some clones are markedly stretched in the anterior facial region. (E to G) Distribution of ectomesenchymal single-color–labeled clones in the periocular posterior maxillary region. Note the irregular geometry of clonal envelopes and their well-defined borders. (F and G) Magnified regions outlined in (E). (H) Sagittal section through the head of a genetically traced embryo starting from E8.5 and analyzed at E17.5. Area of the maxilla and frontonasal prominence with individual traced clones acquiring conical shape (dotted line) in the anterioposterior direction. (I) Transversal section through the upper jaw of the genetically traced E17.5 embryo. Note the compact shape and defined borders of the RFP+ clone (outlined by the dotted line). Arrowheads point at whisker follicles. (J) Graph showing the increasing size and variability of individual ectomesenchymal clones during facial development. (K) Graph showing the proportional occupied clonal volume and related variability of individual ectomesenchymal clones at different developmental stages. (L and M) Graphs visualizing developmental dynamics of clonal density (L) and its heterogeneity (M) measured as an average distance between cells of one clone (closest-neighbor approach) and SD of this parameter per clone, respectively. Bars show mean (black) and SEM (blue). (N) Examples of ectomesenchymal clonal envelopes from an E12.5 embryo with traced neural crest–derived progenies. Note the isotropic structure of clones and well-defined borders with irregular curvature. (O) Histogram showing spatial isotropicity based on pairwise distances between cells sharing a common clonal origin in experimentally obtained ectomesenchymal clones at E17.5. All images are maximum-intensity projections of confocal stacks, except (C) and (D) with volume rendering of isosurfaces. BA1 and BA2, the first and the second branchial arches; NP, nasal prominence. The eye is outlined by the dashed line. Scale bars, 200 μm (A to C and E to O) and 30 μm (D).
