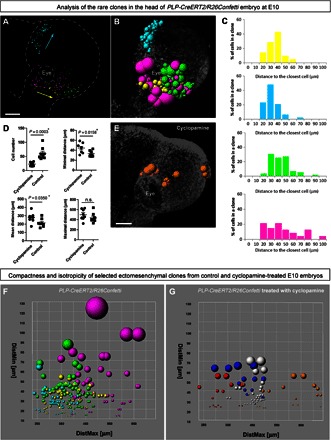
Fig. 2. Analysis of clonal structure in the faces of E10 control and cyclopamine-treated embryos.

(A) Distribution of analyzed clones from PLP-CreERT2/R26Confetti head. Purple, yellow, and green colors mark different rare dual-color clones, whereas cyan represents the rare GFP+ clone. (B) Spatial structure of clones: Radiuses of colored spheres (representing single cells) correspond to minimal distances to the closest neighbors. When all cells in a clone are analyzed, this parameter reflects the compactness of the clone. (C) Histograms showing distances to the closest neighbor for every cell in the clone. (D) Graphs showing differences between wild-type and cyclopamine-treated ectomesenchymal clones in the faces of E10 embryos. Each point represents the average of the following parameters determined for each cell within a single clone: minimal distance, distance to the closest cell; mean distance, mean distance between one cell and all other cells in the clone; and maximal distance, distance to the furthest cell in the same clone. (E) Spatial structure of a clone from a cyclopamine-treated embryo. Radiuses of colored spheres (representing single cells) correspond to minimal distances to the closest neighbors. (F and G) Plots reflecting the compactness and clonal structure of analyzed clones from control (left) and cyclopamine-treated (right) E10 embryos. Colored spheres on these plots correspond to individual cells. Color defines a clone. The radius of spheres reflects the distance to the most proximal neighbor cell (DistMin) in a clone. DistMax is the maximal distance between a given cell and the most distal cell from the same clone. When the entire clone is analyzed, this parameter describes the spatial dimension of the clone. Scale bars, 200 μm (A and E). n.s., not significant.
