
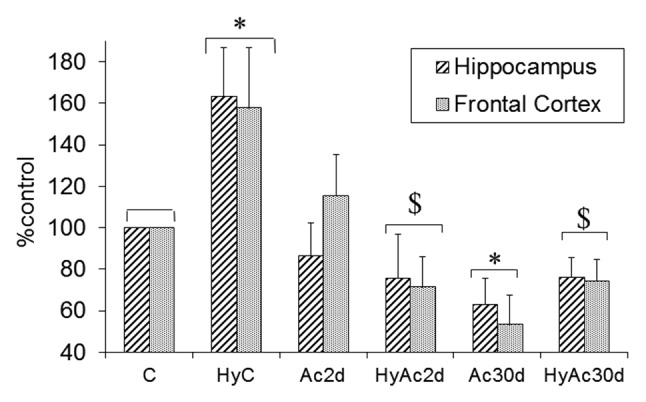
Figure 2. GluN1 Hippocampus Vs. Frontal Cortex. Changes in GluN1 subunit levels in enriched membranal lysates of the hippocampus and frontal cortex after each treatment are shown. No significant differences were found between the frontal cortex and the hippocampus. Each bar represents M ± SE, n = 8. C-controls, Ac2d-heat acclimation for 2 d, Ac30d - heat acclimation for 30d, HyC -hypoxic stress only; HyAc2d - hypoxic stress in rats acclimated for 2 d; HyAc30d - hypoxic stress in rats acclimated for 30 d; * P < 0.05 vs. C; $ P < 0.05 - HyAc30d vs. HyC.