
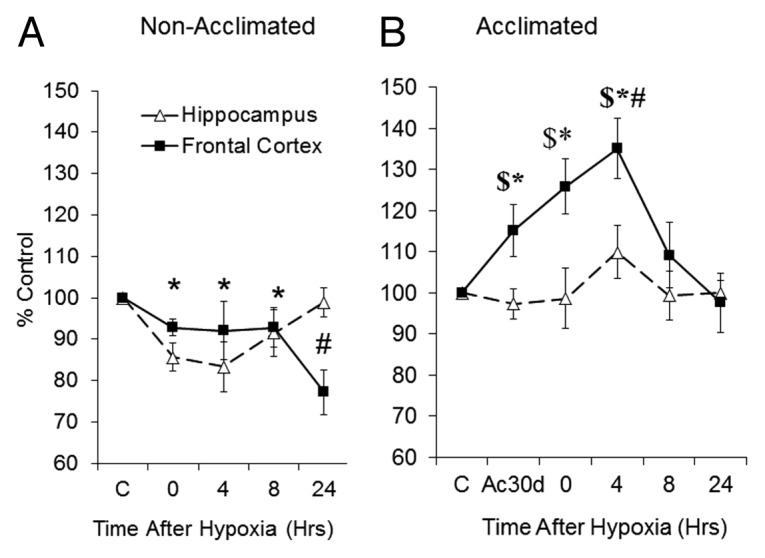
Figure 5. Post-hypoxic GluN2B/GluN2A kinetics. Changes in GluN2B/GluN2A subunit ratio over time in (A) non-acclimated and (B) heat acclimated groups. Each data point represents M ± SE, n = 8. * P < 0.05 both areas vs. C, # P < 0.05 frontal cortex vs. matched basal. $ P < 0.05 frontal cortex vs. hippocampus within the same group.