
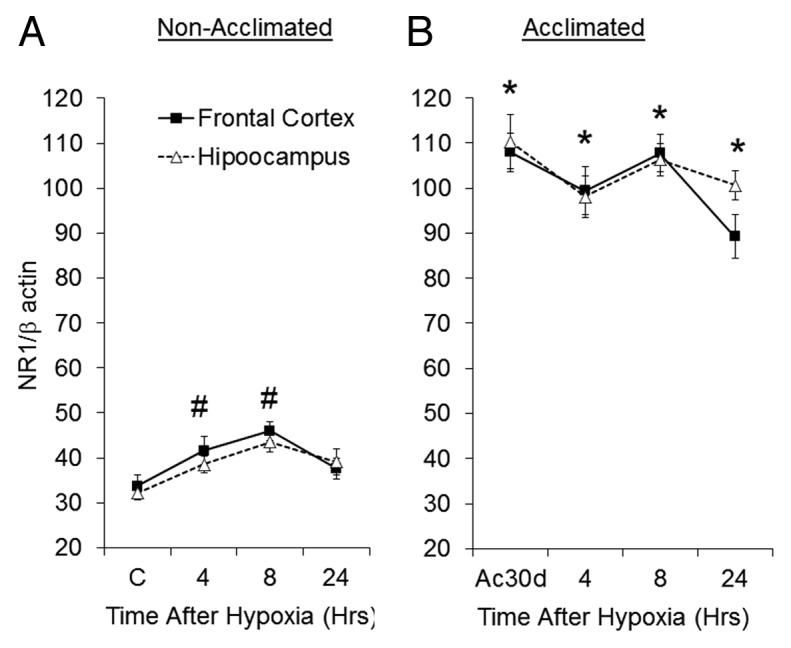
Figure 7. Changes in GluN1 mRNA following hypoxic stress in (A) non-acclimated and (B) acclimated groups. Each data point represents M ± SE, n = 8. # P < 0.05 frontal cortex and the hippocampus vs. C group. * P < 0.05 C vs. Ac30d (for both areas).
Official websites use .gov
A
.gov website belongs to an official
government organization in the United States.
Secure .gov websites use HTTPS
A lock (
) or https:// means you've safely
connected to the .gov website. Share sensitive
information only on official, secure websites.
Figure 7. Changes in GluN1 mRNA following hypoxic stress in (A) non-acclimated and (B) acclimated groups. Each data point represents M ± SE, n = 8. # P < 0.05 frontal cortex and the hippocampus vs. C group. * P < 0.05 C vs. Ac30d (for both areas).