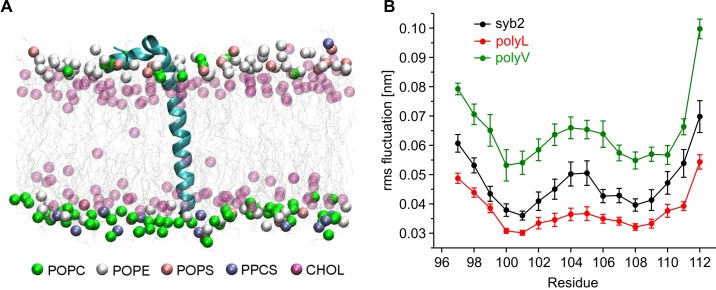
Figure 4. Conformational flexibilities of syb2 and its mutant variants.
(A) Snapshot from the atomistic simulation for inserted syb2 (residues 71–116) in an asymmetric, self-assembled membrane (cytoplasmic leaflet, top; intravesicular leaflet, bottom) with the protein backbone depicted in cartoon representation. The phosphate atoms of lipid and the hydroxyl carbon of cholesterol are shown in the Van der Waals representation. Other atoms of the lipids are shown as grey lines (water molecules are not shown for clarity). Different lipid moieties are depicted according to the colour code shown below. Note the asymmetric lipid composition of the bilayer. (B) Root mean square fluctuations (RMSF) of C-α atoms derived from 40 ns simulation runs for syb2 and the mutants relative to the average structure of the corresponding peptide. Flexibility of the TMD region (residues 97–112) was determined from non-overlapping 10 ns periods during the last 30 ns of the trajectories for each simulation. The polyV region of the mutant showed on average an increased flexibility (0.0644 ± 0.0029 nm, p<0.001), while the polyL region (0.0374 ± 0.0017 nm, p<0.05) showed a decreased jitter when compared with syb2 (0.0472 ± 0.0022 nm, one-way analysis of variance versus syb2). Error bars are s.e.m. of averages calculated from the values of the individual 10 ns windows (n = 9 for wt, n = 6 for mutants).

