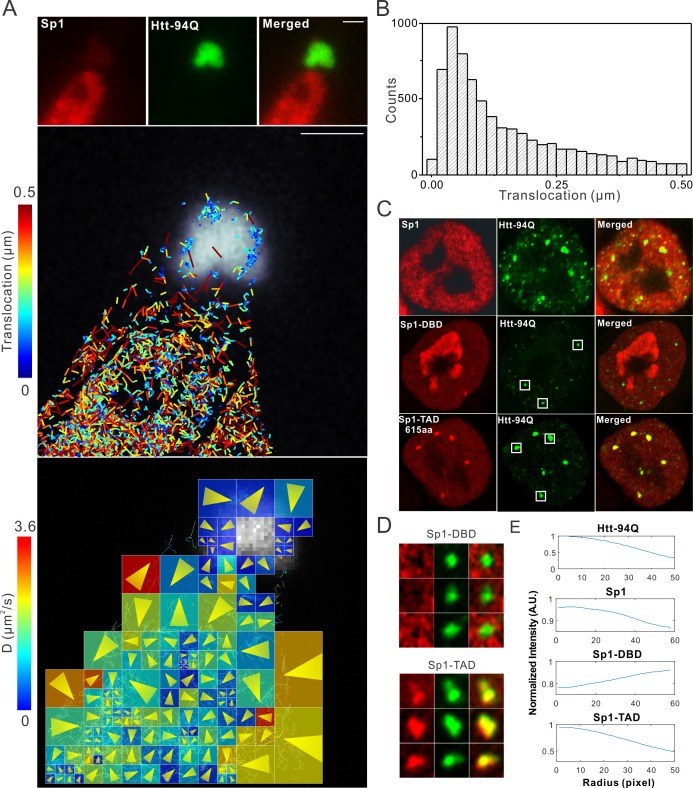
Figure 4. Single-molecule imaging of Sp1 binding to mHtt aggregates.
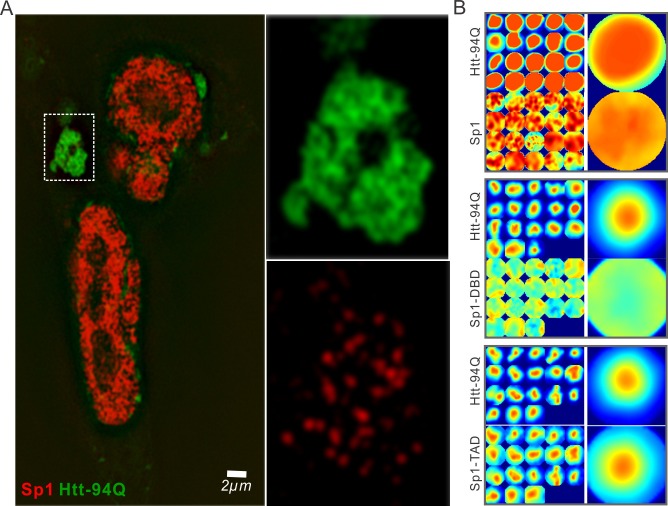
(A) Single-molecule imaging of cytoplasmic Sp1-mHtt aggregate interaction Top, Epi-fluorescence images of JF549-HaloTag-Sp1 (red) and mHtt-94Q-CFP (green) before single-molecule imaging Middle, 2D molecular interaction map of Sp1 binding to mHtt aggregates. Two-point translocations are color-coded according to the jumping distance shown in (B). 7399 translocations are included in this analysis. See Video 6 for single molecule tracks overlaid on raw data. A total of 215 (trajectories) Sp1 binding events were detected on the surface of the aggregate. Bottom, Diffusion map generated by InferenceMap as shown in Figure 1A. Each pixel in the image is color-coded with the most probable diffusion coefficient for that pixel. (B) Histogram for jumping distances shown in the middle panel of (A). (C) Two-color Airyscan images of ES cells expressing indicated Sp1 fragment (red, JF646) and mHtt-94Q-mEOS3.2-NLS (green). (D) Zoom-in view of mHtt aggregate regions boxed in (C) shows that Sp1-TAD is recruited to mHtt aggregates while Sp1-DBD is excluded. Radial intensity analysis of HaloTag-Sp1, HaloTag-DBD and HaloTag-TAD (Imaging data are shown in Figure 4—figure supplement 1B) shows specific enrichments of Sp1 and Sp1-TAD but depletion of Sp1-DBD at mHtt aggregate regions. Scale bars, 2 µm


