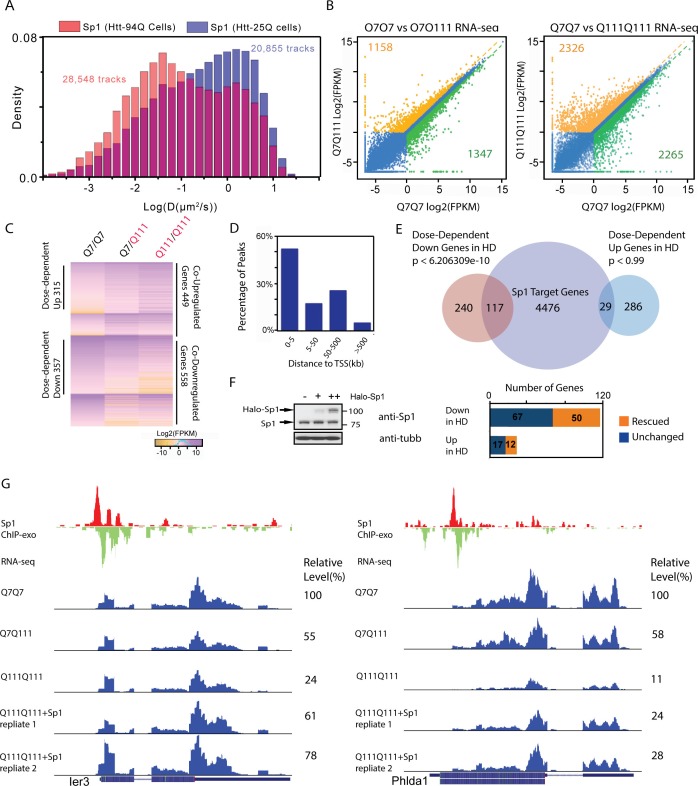
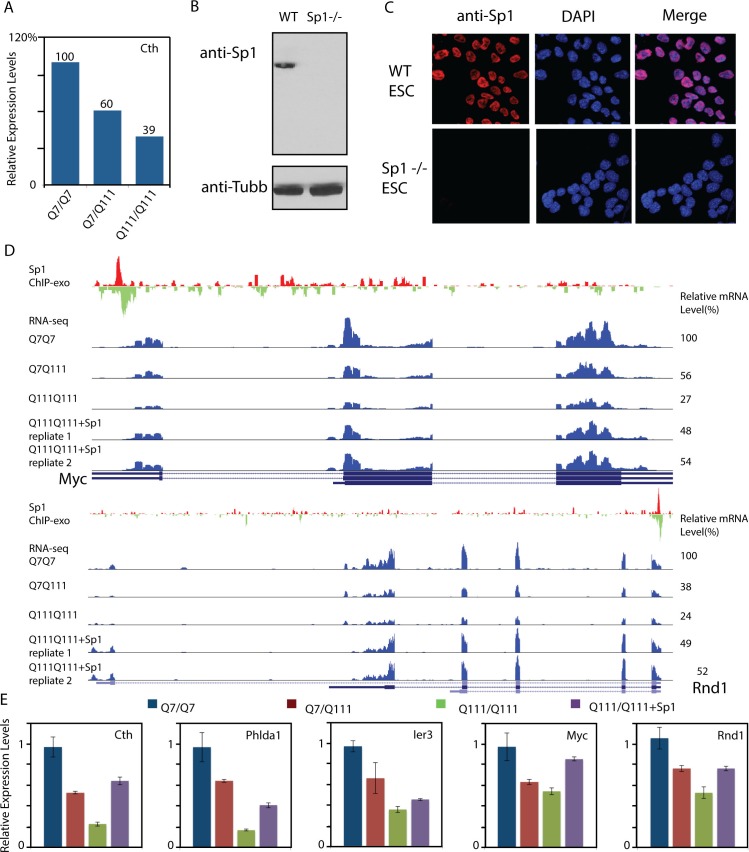
Figure 7. Elevated Sp1 levels rescue a subset of Htt-111Q dose-dependent down-regulated genes in cultured striatal cells.
(A) mHtt aggregates slow down Sp1 diffusion in the nucleus. Histogram (Red) of diffusion coefficients for Sp1 trajectories (28,548) in mHtt aggregate containing cells (N = 12 cells) and that for Sp1 trajectories (20,855) in Htt-25Q control cells (N = 12 cells). In this experiment, HaloTag-Sp1 is labeled with PA-JF646 (See Materials and methods for details). (B) mRNA-Seq differential gene-expression analysis for indicated sample pairs. Each dot in the plot represents one gene. The log2 scale values of FPKM (Fragments Per Kilobase of transcript per Million mapped reads) of the gene for the comparing samples are plotted. Orange dots, 1.5-fold up-regulation compared to wildtype; green dots, 1.5-fold down compared to wildtype. Orange number, total number of 1.5-fold up-regulated genes; Green number, total number of 1.5-fold down-regulated genes. (C) Heatmap showing Q111 dose-dependent gene expression changes. Genes that are up/down regulated in Q111 dose dependent or independent fashion are clustered. Co-regulated up/down genes: genes that are up/down regulated in both Q111/Q7 and Q111/Q111 striatal cells. The expression level of each gene is color-coded. For each group, genes are ranked by the expression levels in the wild-type control (Q7/Q7). (D) Percentage of Sp1 ChIP-exo peaks in core and proximal promoter (0–5 kb), distal region (5–50 kb), intergenic region (50–500 kb and > 500 kb) of annotated Refseq TSS in wild type striatal cells (Q7/Q7), the distribution was calculated by GREAT (McLean et al., 2010). (E) Venn diagram showing overlaps between Sp1 target genes and genes showing Q111 dose-dependent changes in Htt mutant striatal cells. Sp1 target genes are defined as genes with Sp1 peaks within 10 kb of their TSS. 124 of dose-dependent down-regulated genes have Sp1 binding events within 10 kb from their TSS (p<2.07e-8, hypergeometric test). (F) Sp1 overexpression in Htt homozygous mutant cells (Q111Q111) rescues the expression levels of a fraction of its direct target genes. Left panel, western blot using anti-Sp1 antibody to show expression of endogenous and Halo-tagged Sp1 in Q111/Q111 striatal cells with no (-), low (+) and high (++) expression level of HaloTag-Sp1. Q111/Q111 lines with high HaloTag-Sp1 expression level were used in RNA-seq experiments to evaluate gene expression rescue. Right panel, Bar graph showing the numbers of rescued (1.5 fold up- or down- regulated compared to Q111/Q111) and unchanged Sp1 dose-dependent targets upon HaloTag-Sp1 overexpression. (G) Representative ChIP-exo and RNA-seq tracks of Q111 dose-dependent downregulated Sp1 target genes that were rescued by HaloTag-Sp1 overexpression. Left panel: Ier3, Right panel: Phlda1. ChIP-exo tracks show 5’-end of sequence tags on the sense (red) and anti-sense (green) strands. For RNA-seq tracks, y-axle was set to the same scale (0–460 for Ier3, 0–675 for Phlda1).


