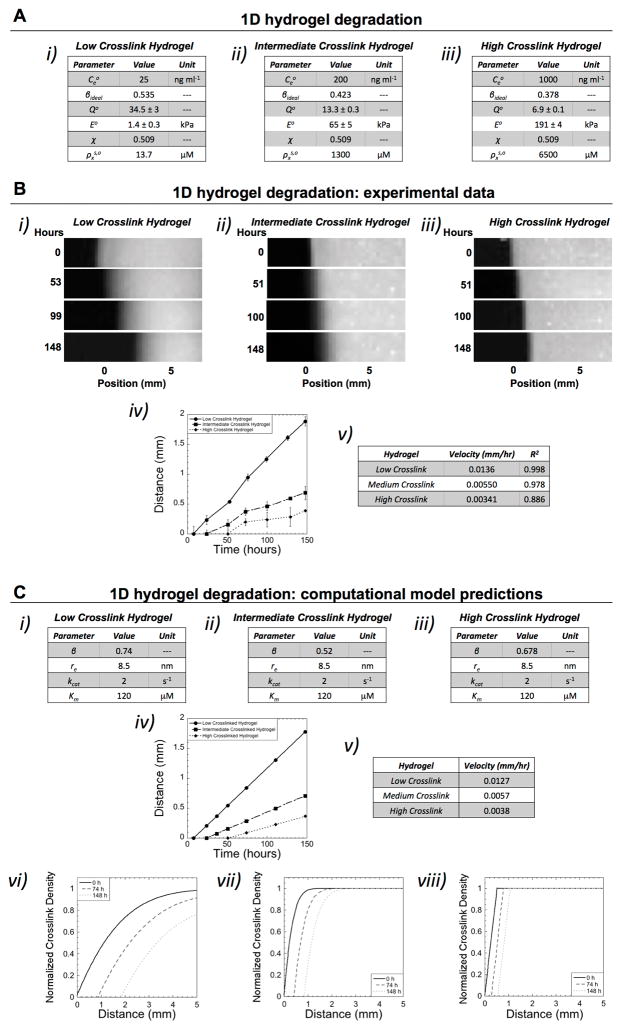
Figure 1.
Characterization of hydrogel degradation in 1D. A) Three hydrogels with differing enzyme concentrations were investigated with their properties of: enzyme concentration ( ), which was maintained throughout the experiment, network connectivity (β), initial volumetric swelling ratio (Qo), initial compressive modulus (Eo), polymer-solvent interaction parameter (χ), and initial crosslink density in the swelling solvent (i.e., phosphate buffered saline) ( ).B) Using the experimental set-up described in Scheme 1C, fluorescent images are shown for each hydrogel case as a function of time whereby position ‘0 mm’ indicates the initial edge of the hydrogel prior to degradation (i–iii). The enzyme source is located to the left of the hydrogel. The front, corresponding to reverse gelation, can be observed advancing away from the initial position (i.e., 0 mm) of the hydrogel over time. The velocity of the front was determined by plotting distance of the front as a function of time and using a linear fit (n=3, data are mean with standard deviation as error bars) (iv–v). B) The mathematical model was fit to the experimental data by varying network connectivity (β), radius of active enzyme (re), and the Michaelis-Menten kinetic constants (kcat and Km), which are unknowns (i–iii). The propagating front (distance versus time) and the corresponding velocity are shown for each hydrogel case (iv–v). In addition, spatiotemporal pattern of crosslink density as a function of distance away from the enzyme source are shown for each crosslink hydrogel case for the initial time prior to degradation and after 74 and 148 hours (vi–viii). The initial variation in crosslink density was determined from the experimental system (at time 0), which arises from unconfined swelling at the edges of the hydrogel.

