Figure 2.
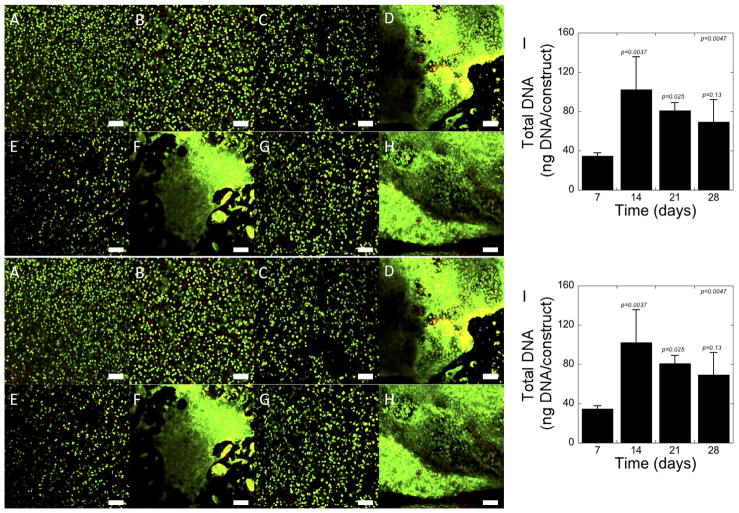
Cellular viability and DNA content of photo-clickable and degradable PEG hydrogels with encapsulated chondrocytes. LIVE/DEAD® images were acquired at day 1 (A), day 7 (B), day 14 (C,D), day 21 (E, F) and day 28 (G, H). Live cells were stained green with calcein AM and dead cells were stained red with ethidium homodimer. Scale bars indicate 100 μm. The DNA content (I), an indicator for total cell number, was measured at day 7, 14, 21 and 28. p-values are reported for one-way ANOVA (α=0.05) in the upper corner with time as the factor. p-values above each column indicate significance compared to day 7. Data are presented as mean with standard deviation as error bars, n=3–4.

