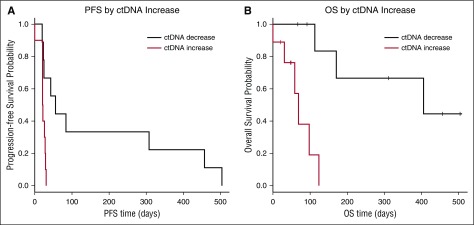
Figure 4.
Correlating treatment response with ctDNA fluctuations. Shown are Kaplan-Meier survival curves comparing the outcome of patients with significant increases in ctDNA between day 0 and day 15 (red) to those with significant decreases (black). (A) PFS for patients with increased ctDNA was significantly shorter (P = .0049, log-rank test) with a hazard ratio of 1.73 (95% CI 1.49-21.2). (B) OS was also significantly shorter for patients with increases in ctDNA (P = .00117, log-rank test) with a hazard ratio of 16.52 for progression (95% CI 1.89-144.3).

