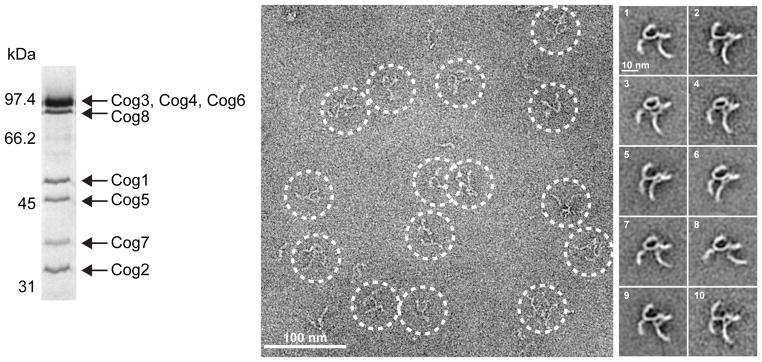
Figure 1.
Purification and negative-stain EM of the yeast COG complex. At the left is the purified S. cerevisiae Cog1-8 complex visualized by SDS-PAGE and Coomassie Blue staining. At the right are a representative image field and a gallery of class averages (see also Supplementary Fig. 2). The uncropped gel image is shown in Supplementary Data Set 1.

