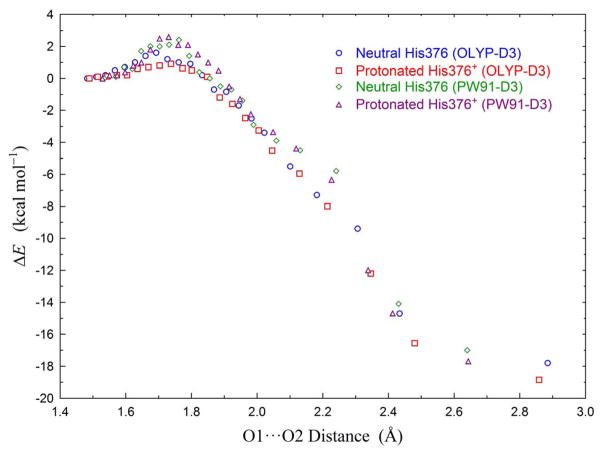
Figure 5.
PW91-D3 and OLYP-D3 transitional energy plots vs. O1-O2 distances along the Fe3+-(O-OH)2−-Cu2+-Y237−-H376/H376+ → Fe4+=O2−···HO−-Cu2−-Y237•-H376/H376+ (Fig. 3A → Fig. 4B) pathway. Energies are relative to the corresponding geometry optimized Fe3+-(O-OH) 2−-Cu2+-Y237−-H376/H376+ state. 1) Blue circles: OLYP-D3 calculations with neutral His376. 2) Red squares: OLYP-D3 calculations with protonated His376+. 3) Green diamonds: PW91-D3 calculations with neutral His376. 4) Purple triangles: PW91-D3 calculations with protonated His376+. The calculated properties of the highest-energy structures are given in Table 3.

