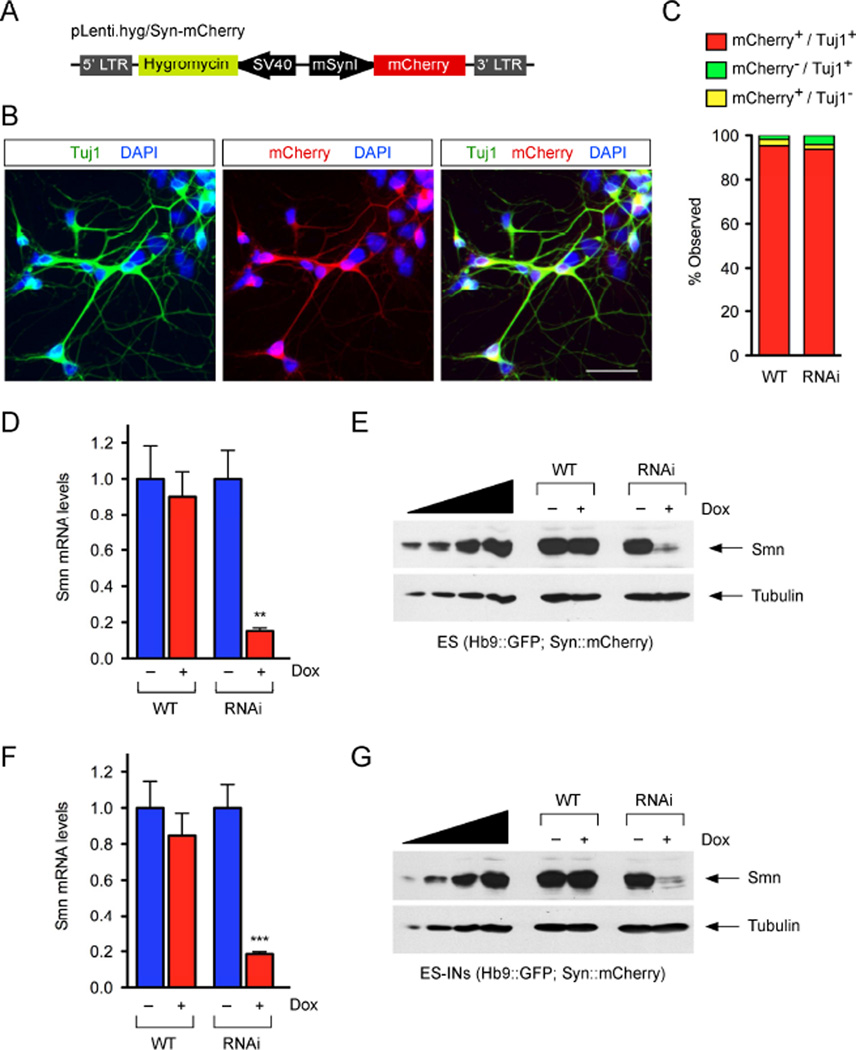
Figure 4. Development of ES cell lines for the purification of INs with inducible Smn knockdown.
(A) Schematic representation of the lentiviral vector used to generate WT and RNAi ES(Hb9::GFP;Syn::mCherry) cell lines. (B) Representative images of ES(Hb9::GFP;Syn::mCherry)-derived neuronal cultures expressing mCherry (red) and stained with Tuj1 (green) and DAPI (blue) at 5DIV. (C) Quantification of mCherry+/Tuj1+ INs in neuronal cultures differentiated from WT and RNAi ES(Hb9::GFP;Syn::mCherry) cells as in B (n≥3). Scale bar=100µm. (D) RT-qPCR analysis of Smn mRNA levels in WT and RNAi ES(Hb9::GFP;Syn::mCherry) cells cultured with and without Dox for 4 days. RNA levels in Dox-treated cells are expressed relative to those in untreated cells. Data are represented as mean and SEM from independent experiments (n=3). (E) Western blot analysis of Smn protein levels in WT and RNAi ES cells cultured as in D. A two-fold serial dilution of WT ES cell extract is analyzed on the left. (F) RT-qPCR analysis of Smn mRNA levels in FACS-purified INs differentiated from WT and RNAi ES cells cultured with and without Dox for 5 days. RNA levels in Dox-treated cells are expressed relative to those in untreated cells. Data are represented as mean and SEM from independent experiments (n=3). (G) Western blot analysis of Smn protein levels in mixed cultures of ES-INs cultured with and without Dox for 5 days after differentiation from WT and RNAi ES cells. A two-fold serial dilution of the extract from WT ES-INs is analyzed on the left. See also Figure S4.

