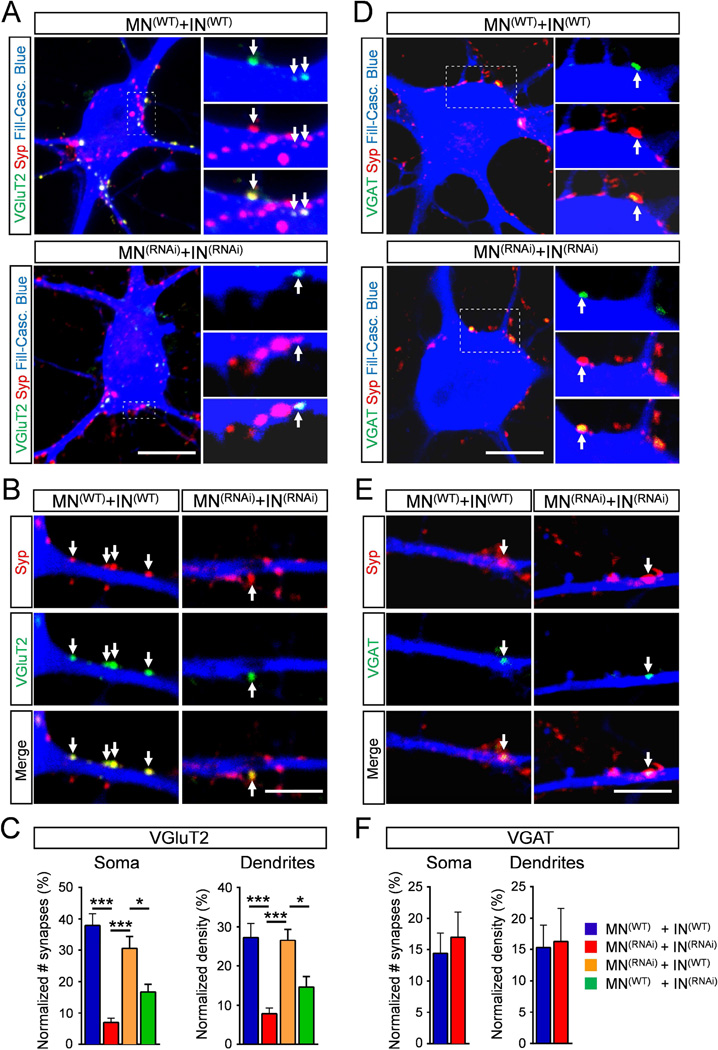
Figure 6. Smn deficiency in INs leads to loss of excitatory synapses onto MNs.
(A–B) Superimposed images of VGluT2 (green) and Syp (red) immunoreactivity on the soma and the dendrites of a Cascade blue intracellularly-filled MN (blue) in co-cultures of MNs and INs differentiated from either WT or RNAi ES cells as indicated. Arrows indicate VGluT2 synapses. (C) Number of VGluT2 synapses relative to all Syp+ synapses onto the soma and dendrites of MNs from all four co-culture combinations. MN(WT)+IN(WT), n=11; MN(RNAi)+IN(RNAi), n=12; MN(RNAi)+IN(WT), n=10; MN(WT)+IN(RNAi, n=10. (D–E) Superimposed images of VGAT (green) and Syp (red) immunoreactivity on the soma and the dendrites of MNs as in A. Arrows indicate VGAT synapses. (F) Number of VGAT synapses relative to all Syp+ synapses onto the soma and dendrites of MNs from two co-culture combinations. MN(WT)+IN(WT), n=8; MN(RNAi)+IN(RNAi), n=7. Scale bar=10µm (soma) and 5µm (dendrites). See also Figure S6.

