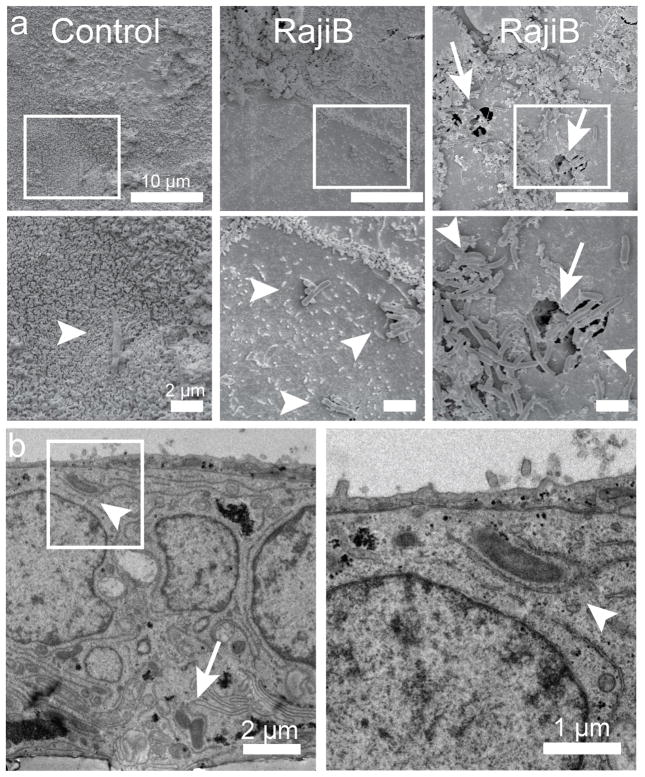
Fig. 3. Electron microscopy of Mtb transcytosis by M-cells in tissue culture.
Control or RajiB-co-cultured transwells were infected with Mtb for 30 minutes, fixed and imaged by scanning (a) and transmission (b) electron microscopy. Boxes (a, top) are magnified in lower panels (a, bottom). a, Rare Mtb (arrowheads) were observed overlying cells with microvilli in control wells. In RajiB cocultures, bacteria were visualized predominantly on M-cells. Occasionally, large clumps of bacteria were observed entering large cell surface pores (arrow). Scale bars are 10 μm (a, top), 2 μm (a, bottom and panel b, left) and 1 μm (panel b, right). In (b), only RajiB co-cultured cells are shown. Entering (arrowhead) and exiting (arrow) bacteria can be observed inside an M-cell. Results are representative images from two independent experiments.

