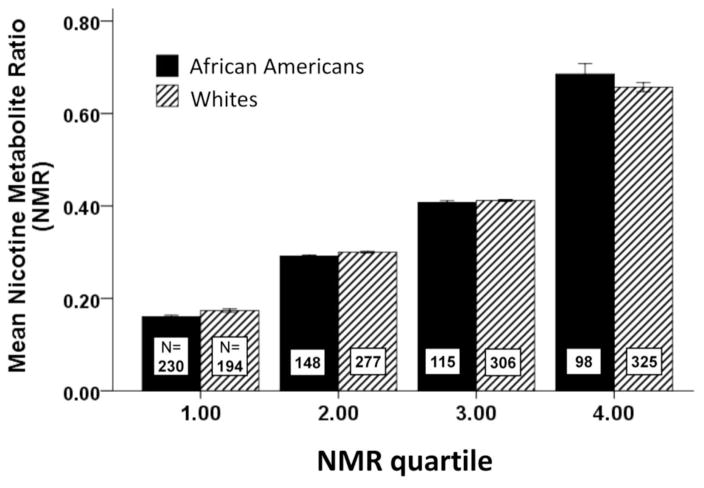
Figure 1.
Mean NMR level for African Americans and Whites within each NMR quartile. NMR quartiles were based on the full sample of African Americans and Whites. The distribution of participants within each NMR quartile is represented by the N’s shown within each bar. Distribution of African Americans and Whites across the NMR quartiles based on the combined sample

