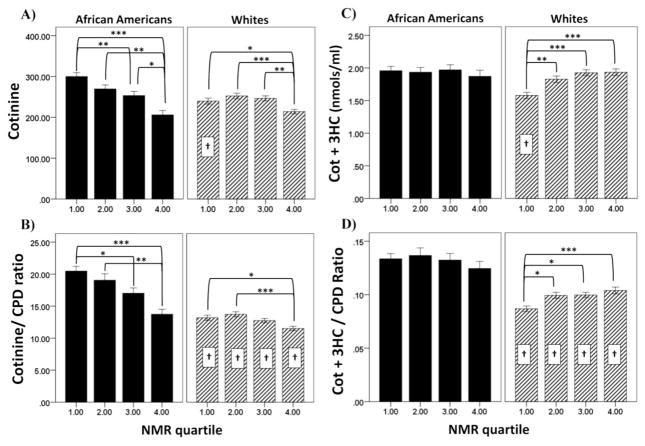
Figure 3.
Relationship between NMR quartile and biomarkers of nicotine exposure in African Americans and Whites. Shown are the means ± SEM for (A) cotinine, (B) [COT+3HC], (C) cotinine per cigarette, and (D) [COT+3HC] per cigarette. Biomarkers are measured in blood. Data are combined for men and women as sex did not significantly influence the results. Significance of within race comparisons between NMR quartiles are indicated by: (*)= p<0.05, (**)= p<0.01, and(***)= p<0.001. Significance for the comparison between African Americans and Whites for the individual NMR quartile are indicated by: (†)= p<0.01.

