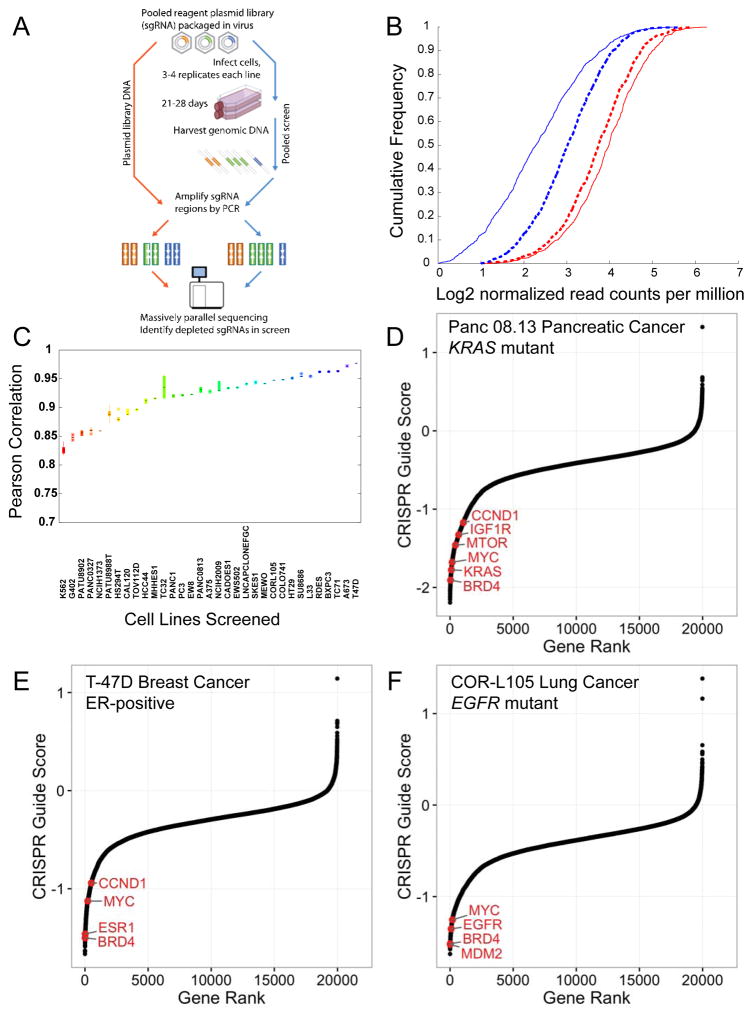
Figure 1.
Genome scale loss-of-function CRISPR-Cas9 screening in cancer cell lines. (A) Schematic of the pooled screening process. (B) Cumulative frequency of log2 normalized read counts per million to 1000 non-targeting sgRNA controls (red) and sgRNAs targeting 213 positive control genes (KEGG ribosome, proteasome and spliceosome subsets, Table S2) (blue) in both the initial DNA reference pool (dotted) and 28 d after transduction in the PANC-1 cell line (solid). (C) A boxplot of Pearson correlation between replicates (y-axis) plotted for each cell line (x-axis) shows the range of replicate-replicate correlations after quality control (Methods). (D, E, F) Rank ordered depiction of second-best CRISPR guide scores for each gene in the Panc 08.13 (D), T47D (E) and CORL105 (F) cell lines. Hallmark cancer-relevant oncogene and non-oncogene dependencies are depicted in red for each cell line.

