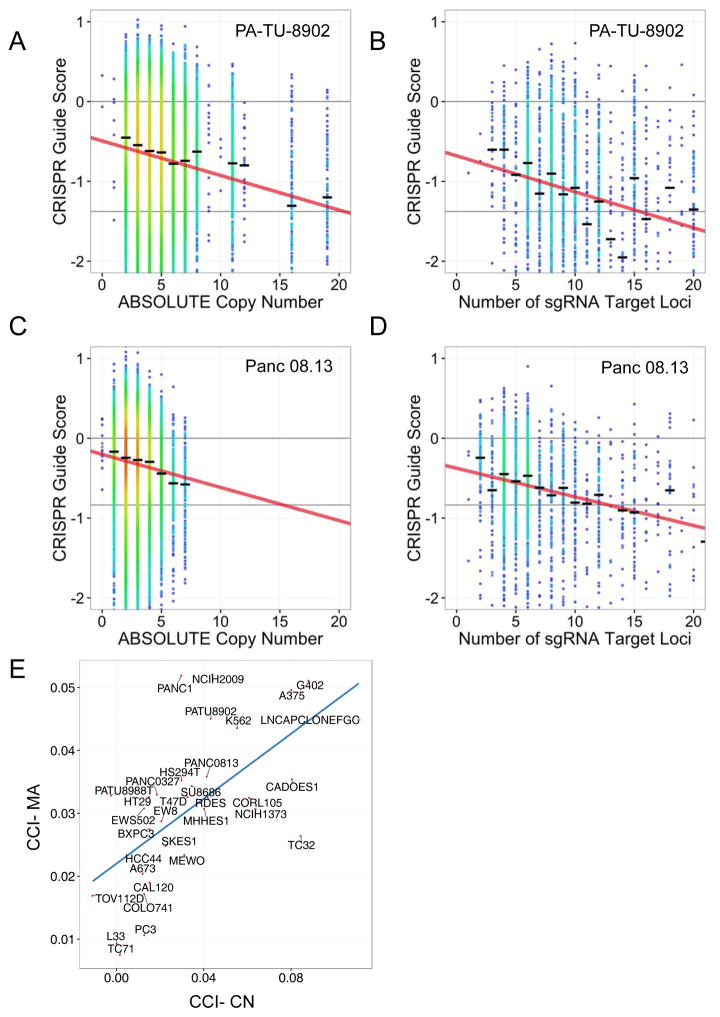
Figure 4.
CRISPR-Cas9 sensitivity correlates with number of predicted cuts for both guides targeting single loci and multiple loci. Data from two representative cell lines are shown (PA-TU-8902, A–B; Panc 08.13, C–D) (A, C) CRISPR-Cas9 sensitivity for sgRNAs targeting only a single locus is plotted against copy number of that locus. The black hash marks represent the median CRISPR guide score for all guides targeting a locus at that copy number. The linear trendline is shown. (B, D) CRISPR-Cas9 guide scores for sgRNAs targeting multiple loci, are plotted against the predicted number of cuts for each sgRNA. Only sgRNAs targeting non-amplified regions are included, thus allowing segregation of the impact of multiple CRISPR-Cas9-induced DNA cuts due to either copy number or number of target loci. The influence of the number of predicted DNA cuts on CRISPR-Cas9 guide scores was modeled for each cell line as the slope of the trend line in A–D and termed the CRISPR-Cut Index (CCI). The CCI was determined for both copy number-driven (CCI-CN) (A, C) and multiple alignment-driven effects (CCI-MA) (B, D). (E) Scatter plot of CCI-MA versus CCI-CN showing strong correlation of the effect on CRISPR-Cas9 guide scores for either multiple alignment driven or copy number-driven DNA cuts across the cell lines.

