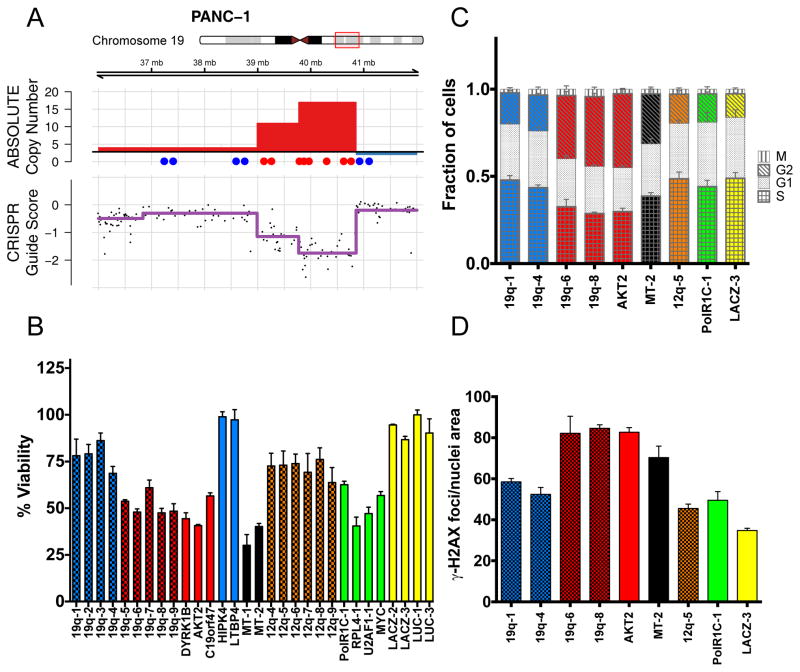
Figure 6.
CRISPR-Cas9 targeting of amplified regions or multiple genomic loci induces DNA damage and a G2 cell cycle arrest. (A) Schematic of the PANC-1 19q13 amplicon demonstrating ABSOLUTE DNA copy number (top panel) and CRISPR guide scores (middle panel) mapped by genomic position. Schematic and color scheme are similar to that detailed in Fig. 2. (B) In vitro validation experiment measuring arrayed proliferation and viability response of PANC-1 cells at 6 d post-infection with sgRNAs targeting regions inside (red) and outside (blue) of the demonstrated amplicon. sgRNAs targeting intergenic regions are labeled by chromosomal locus and columns are given a checkered pattern. Multi-targeted sgRNA’s (MT-1 and MT-2) are indicated by black bars. sgRNAs targeting an alternative unamplified locus (12q, orange) and known essential genes (green) are also shown. Non-targeting negative control sgRNAs are shown in yellow. Dots placed below the copy number panel correspond to the validation sgRNAs targeting the indicated genes or intergenic regions on the locus, and are matched by color and left-to-right genomic position. Cell-Titer-Glo was performed at 6-days post-infection. Error bars indicate SD of biologic replicates (n=3). p < 0.0001 for two-tailed T-test comparing sgRNAs inside (red) vs outside (blue and orange) the amplicon. (C) Plot of the percentage of PANC-1 cells in each phase of the cell cycle at 48 hours post-infection with the indicated sgRNAs targeting inside (red) or outside (blue) the amplicon. Data for a multi-targeted sgRNA (MT-2) and a control sgRNA targeting an alternative locus (12q-5), as well as for control genes are also shown. Fraction of cells in each phase of the cell cycle is indicated by a unique pattern within the column corresponding to each cell cycle phase. Colors scheme is as indicated above, with coloration of the G2 and S phases for emphasis. Error bars represent the standard deviation for the mean of three replicates. (D) Plot of the number of γ-H2AX foci present in PANC-1 cells at 48 hours post-infection with the indicated sgRNAs. Color scheme is as indicated above, with checkered pattern corresponding to sgRNAs targeting intergenic regions.

