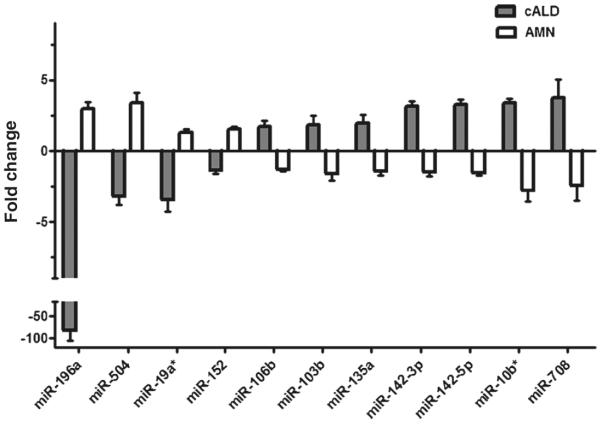
Fig. 1.
Differentially expressed miRNA in cALD (grey) and AMN (white) fibroblasts from miRNome miRNA PCR array. The expression of 1008 most abundantly expressed and best characterized miRNA sequences in the human miRNA genome was profiled using Human miRNome miRNA PCR array (Qiagen-MIHS-216Z) in triplicate. The relative expression was calculated using the ΔΔCT method and is presented as fold change relative to control. Among 1008 miRNAs, 11 miRNAs were significantly differentially regulated between cALD and AMN as shown in the figure. miR-196a was most significantly differentially regulated

