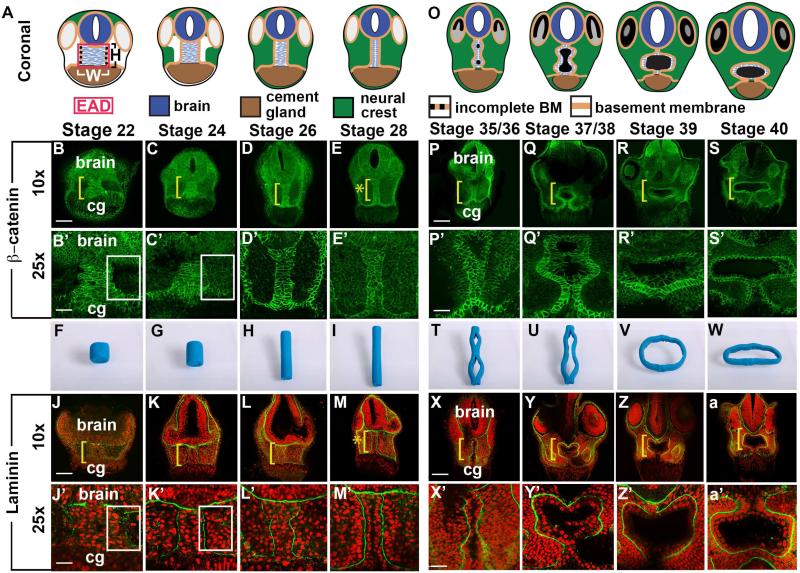
Figure 1.
Coronal anatomy of Xenopus face and EAD ectoderm between late neurula and swimming tadpole. (A, O) Schematic, st. 22-28 and st. 35/36-40. (B-E’, P-S’) Coronal sections with β-catenin immunolabeling (2 independent experiments, st. 22, n=10; st. 24, n=11; st. 26, n=14; st. 28 n=14). Midline region (bracket) with bright β-catenin labeling is EAD ectoderm of the pre-mouth array. Bracket: region of 10x image (B-E, P-S) enlarged in 25x view (B’-E’, P’-S’). Asterisk (E), pre-mouth array at stage 28, enlarged in E’. cg, cement gland. (F-I, T-W) Still frames from claymation of mouth opening found in Movie S2. I, pre-mouth array stage of claymation. (J-M’, X-a’); Coronal sections with Laminin (green) immunolabeling with Propidium Iodide (PI) nuclear counterstain (red) (2 independent experiments, st. 22, n=10; st. 24, n=4; st. 26, n=6; st. 28, n=7). Bracket: region of 10x image (J-M, X-a) enlarged in 25x view (J’-M’, X’-a’). Asterisk (M), pre-mouth array at stage 28, enlarged in M’. (B’, C’, J’, K’) White boxes surround lateral regions next to EAD which fill with NC cells between stages 22 (B’, J’) and 24 (C’, K’). Scale bar (10x): 170μm. Scale bar (25x): 68μm.

