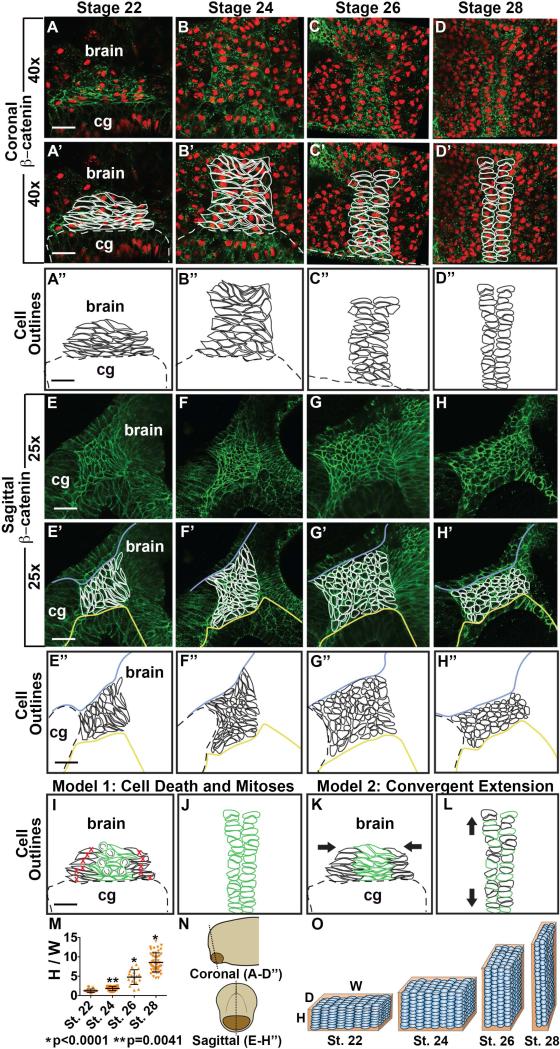
Figure 2.
Detailed anatomy and modeling of Xenopus EAD ectoderm between late neurula and swimming tadpole. (A-D’) Coronal sections with β-catenin (green) immunolabeling with PI nuclear counterstain (red) from stages 22-28 (2 independent experiments, st. 22, n=10; st. 24, n=11; st. 26, n=14; st. 28 n=14). (E-H’) Sagittal sections with β-catenin (green) immunolabeling from stages 22-28 (3 independent experiments, st. 22, n=12; st. 24, n=10; st. 26, n=12; st. 28, n=12). (A’-D’, E’-H’) Cell membranes traced in white. Blue line, separates deep EAD from outer ectoderm. Yellow line, separates EAD ectoderm from endoderm. (A’’-D’’, E’’-H’’) Cell outlines in black. Dotted line: top of cement gland, cg. (D-D’’) Pre-mouth array is present and indicated by cell outlines. Scale bar (25x): 68μm. Scale bars (40x): 43μm. (I-J) Model 1. I, stage 22. J, stage 28. (K-L) Model 2. K, stage 22. L, stage 28. (M) Quantification of height vs. width of EAD (see Methods) (3 independent experiments, st.22, n=12; st. 24, n=16; st. 26, n=17; st. 28, n=47). P values: unpaired, two-tailed T test comparing sequential stages. Error bar: standard deviation. (N) Diagram demonstrating coronal (A-D’) and sagittal (E-H’) sections. (O) Diagram showing the change in height (H), width (W) and depth (D) of the EAD ectoderm and its surrounding BM between stages 22 and 28. Blue ovals, EAD ectodermal cells undergoing convergent extension. Orange rectangular prism, Laminin BM surrounding EAD ectoderm.

