Figure 3.
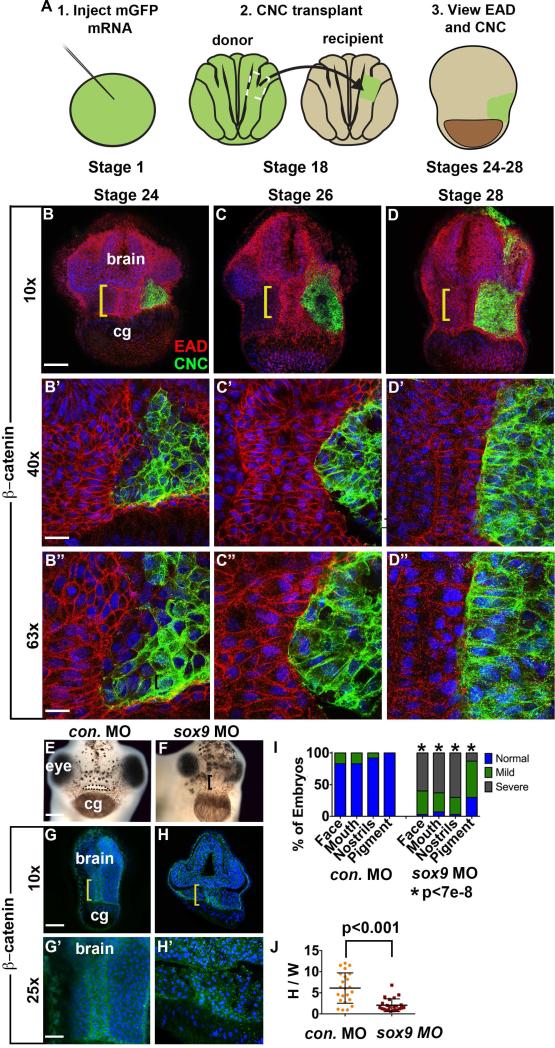
EAD ectoderm undergoes convergent extension (CE) as the cranial neural crest (NC) approaches the midline and EAD CE fails to occur in sox9 LOF embryos. (A) Experimental schematic. (B-D’’) Coronal sections with mGFP-labeled NC (green) and β-catenin (red) immunolabeling from late neurula (stage 24) to late tailbud (stage 28) (2 independent experiments, st. 24, n=7; st. 26, n=7; st. 28 n=4). Midline region (bracket) with bright β-catenin labeling is EAD ectoderm. Bracket: region of 10x image (B-D) enlarged in 40x view (B’-D’) and 63x view (B’’-D’’). cg, cement gland. (E-F) Frontal view of control and sox9 LOF embryos at swimming tadpole (stage 40) assayed in 2 experiments (control MO (E) n=24; sox9 MO (F) n=30.) Dots surround open mouth. Bracket: unopened mouth. Scale bar: 200 m. (G-H’) Coronal sections assayed in 4 independent experiments (n=23) with β-catenin immunolabeling and Hoersch nuclear labeling. Midline region with bright β-catenin labeling is EAD ectoderm. Bracket: region of 10x image (G-H) enlarged in 25x view (G’-H’). cg, cement gland. (I) Graph depicting percent of embryos displaying mouth, face, nostrils and pigment formation phenotypes at st. 40 in control and sox9 LOF embryos. P values: Fisher's exact probability test. (J) Quantification of height over width of EAD (see Methods). P values: unpaired, two-tailed T test. Error bar: standard deviation. Unless otherwise specified, Scale bar (10x): 170μm. Scale bar (25x): 68μm. Scale bar (40x): 43μm. Scale bar (63x): 27μm.

