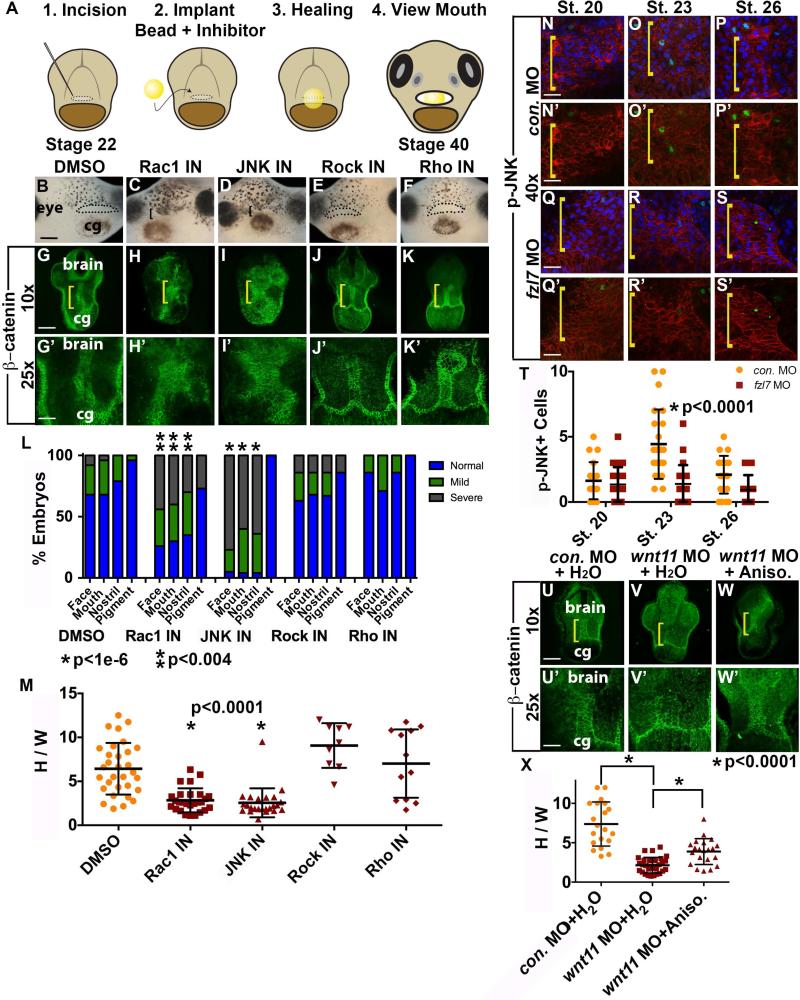
Figure 5.
Inhibition of GTPases JNK and Rac1 is associated with a reduction in EAD ectodermal convergent extension. (A) Experimental schematic of inhibitor loaded bead implantation in the presumptive mouth, EAD region. (B-F) Frontal view of swimming tadpole (stage 40) embryos with inhibitor loaded beads implanted in presumptive mouths, assayed in 3 experiments. ((B) control DMSO n=97; (C) Rac1 n=40; (D) JNK inhibitor n=44; (E) Rock inhibitor n=75; (F) Rho inhibitor n=39.) Bracket: unopened mouth. Dots surround open mouths. cg, cement gland. Scale bar: 200μm. (G-K’) Coronal sections, stage 28, assayed in 3 independent experiments. ((G, G’) control DMSO n=31; (H, H’) Rac1 inhibitor n=27; (I, I’) JNK inhibitor n=24; (J, J’) Rock inhibitor n=9; (K, K’) Rho inhibitor n=12)) with β-catenin immunolabeling. Midline region with bright β-catenin labeling is EAD ectoderm. Bracket: region of 10x image (G-K) enlarged in 25x view (G’-K’). Scale bar (10x): 170μm. Scale bar (25x): 68μm. (L) Graph depicting percentage of embryos, displaying mouth, face, nostrils and pigment formation phenotypes at stage 40. P values: Fisher's exact probability test. (M) Quantification of height over width of EAD (see Methods). P values: unpaired, two-tailed T test. Error bar: standard deviation. (N-S’) Control and fzl7 LOF embryos at stage 20 (N, N’, n=19; Q, Q’, n=26), stage 23 (O, O’, n= 23; R, R’, n=23), and stage 26 (P, P’, n=21; S, S’, n=16) with p-JNK immunolabeling (green), mApple cell membranes (red), and Hoechst nuclear counterstain (blue in N-S) assayed in 2 experiments. Bracket: EAD. Scale bars (40x): 43μm. (T) Quantification of cells with p-JNK positive nuclei in the EAD ectoderm. Total number of EAD nuclei was equivalent between stage matched control and frzl7 LOF embryos. p<0.0006, control stage 23 compared to stages 20 and 26. P values: unpaired, two-tailed T test. (U-W’) Coronal sections, stage 28, assayed in 2 independent experiments. ((U, U’) control water n=20; (V, V’) wnt11 MO + control water n=30; (W, W’) wnt11 MO + Anisomycin JNK-activator n=21) with β-catenin immunolabeling. Midline region with bright β-catenin labeling is EAD ectoderm. Bracket: region of 10x image (U-W) enlarged in 25x view (U’-W’). Scale bar (10x): 170μm. Scale bar (25x): 68μm. (X) Quantification of height over width of EAD (see Methods). Error bar: standard deviation. P values: unpaired, two-tailed T test.

