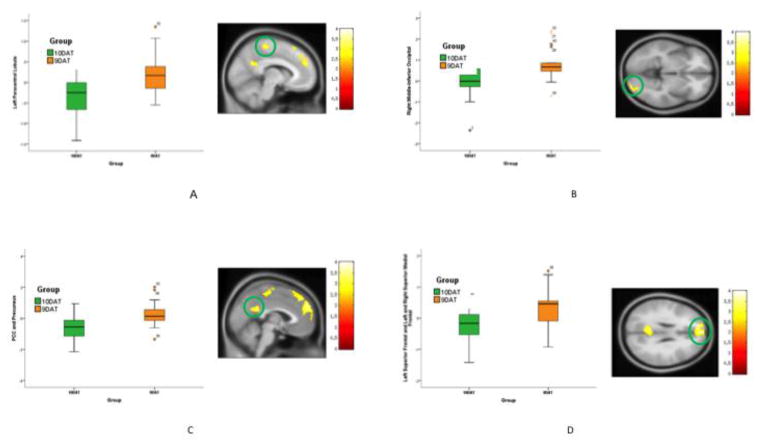
Figure 2. Difference between 10DAT and 9DAT Group Activation for the Sad No-go>Sad Go Condition.
Figure 2 shows the difference between 10DAT and 9DAT groups activation for sad no-go > sad go condition. The statistical significance threshold for examining this effect was set at p=0.01 and a cluster size of 219 voxels corresponded to a corrected p=0.05. (A) Left paracentral lobule, 9DAT>10DAT. (B) Right middle-inferior occipital, 9DAT>10DAT. (C) Left & Right PCC-precuneus, 9DAT>10DAT. (D) Left superior frontal and left & right superior medial frontal, 9DAT>10DAT.

