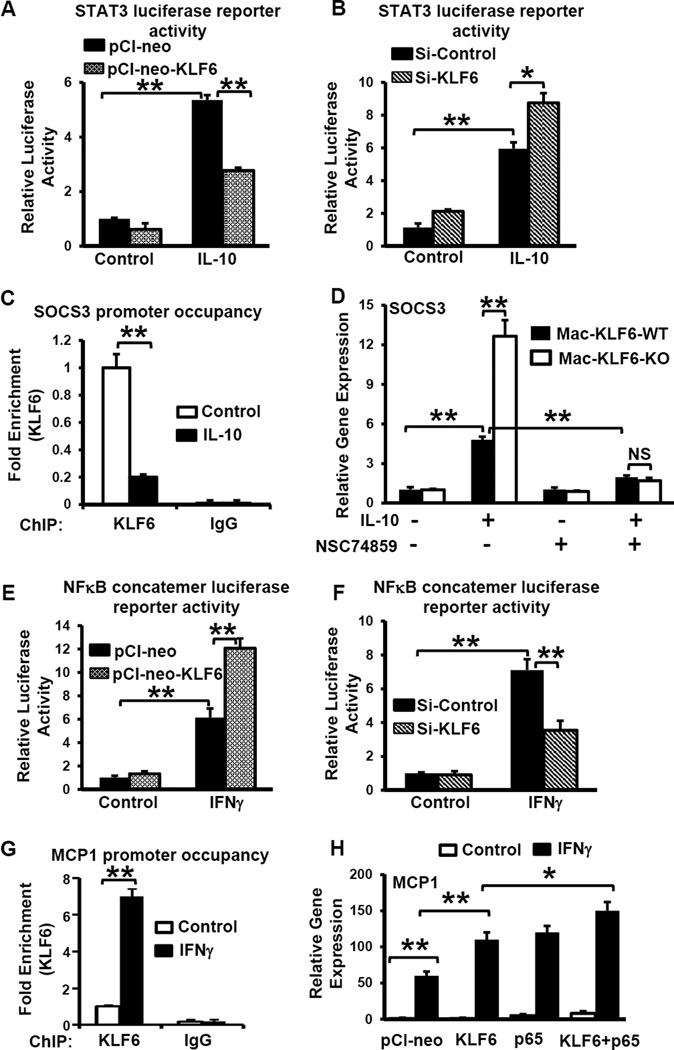
Figure 6. KLF6 interacts with pro-inflammatory and anti-inflammatory transcriptional machinery to regulate gene expression in response to cytokine signaling.
(A) RAW264.7 macrophages were transfected to overexpress KLF6 (pCl-neo-KLF6) or control plasmid (pCl-neo) together with a STAT3 luciferase reporter plasmid. Cells were treated with IL-10 or PBS (control), then assessed for the relative luciferase activity, which is expressed as a ratio of control-transfected cells. (B) RAW264.7 macrophages were transfected with siRNA specific to KLF6 or control (scrambled) RNA, together with a STAT3 luciferase reporter plasmid. Cells were treated with IL-10 or PBS (Ctrl) and then assessed for luciferase activity. (C) Wild-type PMs were treated with IL-10 or PBS (Ctrl) and ChIP assays were performed on the SOCS3 promoter (−313 to −319) following immunoprecipitation with anti-KLF6 or IgG (Ctrl). (D) PMs from indicated mice were treated with IL-10 and/or the STAT3 inhibitor NSC74859 as indicated. Gene expression of SOCS3 was determined by qPCR and is expressed as fold-change over PBS-treated, wild-type PMs. (E) RAW264.7 macrophages were transfected to overexpress KLF6 (pCl-neo-KLF6) or control plasmid (pCl-neo) together with an NFκB luciferase reporter plasmid. Cells were treated with IFNγ or PBS (control), then assessed for the relative luciferase activity. (F) RAW264.7 macrophages were transfected with siRNA specific to KLF6 or control (scrambled) RNA, together with an NFκB luciferase reporter plasmid. Cells were treated with IFNγ or PBS (Control) and then assessed for luciferase activity. (G) PMs were isolated from WT mice, treated with IFNγ or PBS (Ctrl), and ChIP assays were performed on the MCP-1 promoter (−1363 to −1378) following immunoprecipitation with anti-KLF6 or IgG (Ctrl. (H) RAW264.7 macrophages were transfected to overexpress the indicated plasmids, and then stimulated with IFNγ or PBS (Control). Relative gene expression of MCP-1 was determined by qPCR and is expressed relative to PBS-treated, mock-transfected cells. Graphs show mean ± SEM; *p≤0.05; **p≤0.005, n=3.

