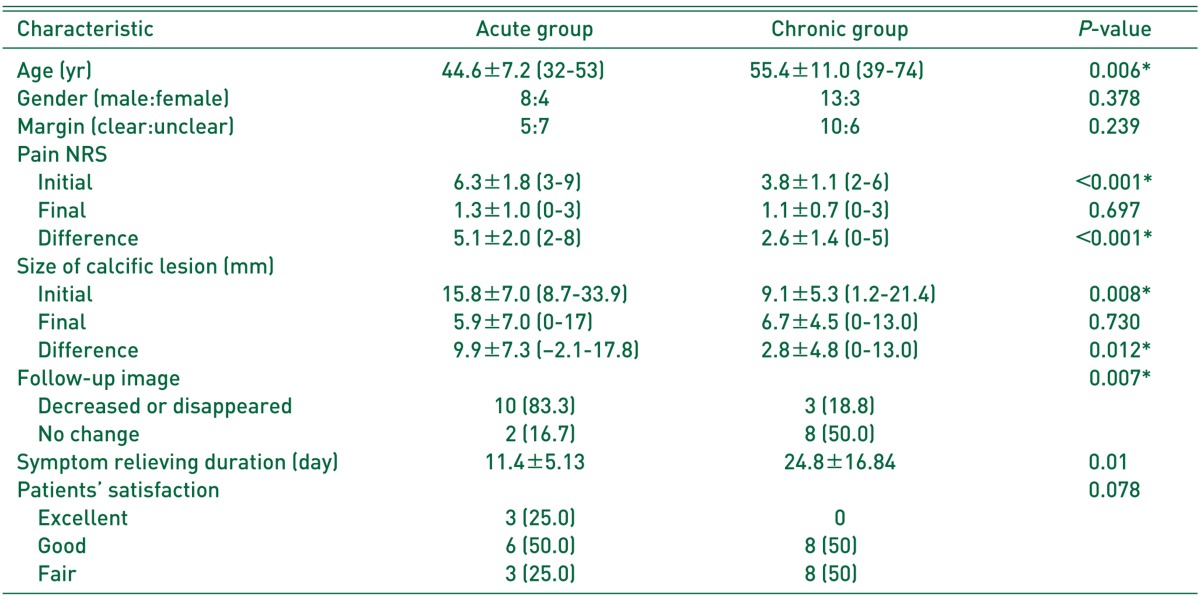
Table 3. Comparison of Characteristics and Outcomes according to Symptom Duration.
Values are presented as mean±standard deviation (range), number only, or number (%).
Acute group: n=12 (42.9%), 1.0 weeks±0.9; chronic group: n=16, (57.1%), 21.0 weeks±19.5.
NRS: Numeric Rating Scale.
* Statistically significant difference.

