
FIGURE 4.
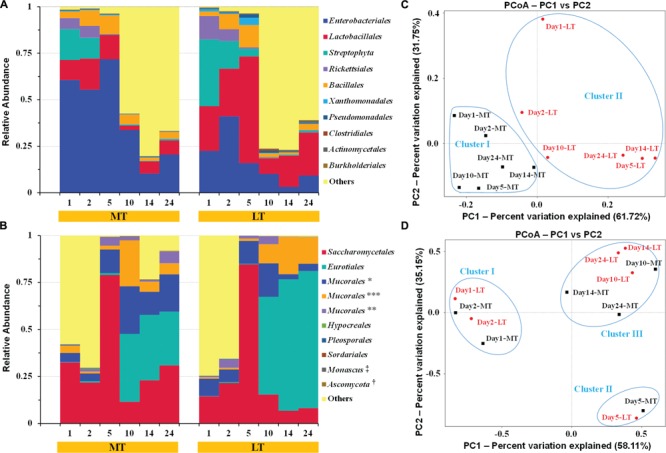
Dynamics of relative abundances of the major bacterial (A) and fungal (B) orders, and the weighted unifrac distance PCoA of bacterial (C) and fungal (D) communities during the MTSSF and LTSSF processes, as obtained by Illumina HiSeq sequencing analysis. The abundance was presented as of percentage of total effective bacterial sequences. The abundances of bacterial “other” orders were <0.40%. The abundances of fungal “other” orders were <0.20%. The taxonomy: ∗, IS–s-Mucorales sp.-Mucorales; ∗∗, IS–s-Rhizomucor pusillus-Mucorales; ∗∗∗, IS–s-Rhizopus arrhizus var. arrhizus-Mucorales; †, Un–s-Ascomycota sp.; ‡, IS–s-Monascus purpureu. The percentages were the percentage of variation explained by the components.