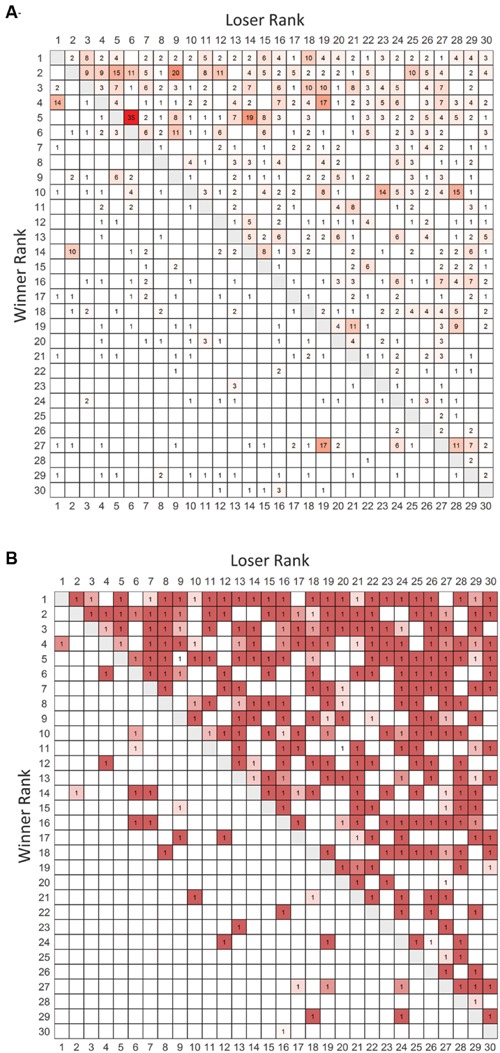
FIGURE 1.

Frequency and binarized win-loss sociomatrices. (A) Total frequency of agonistic interactions between all pairs of individuals. Cells are colored from white (no wins) to red (highest number of wins). (B) Overall winners of each dyad are assigned a value of 1. Cells are colored from white to red with redness being directly related to the directional consistency of each dyad. Winners of each contest are listed in rows and losers are listed in columns. Rows and columns are in I&SI rank order.
