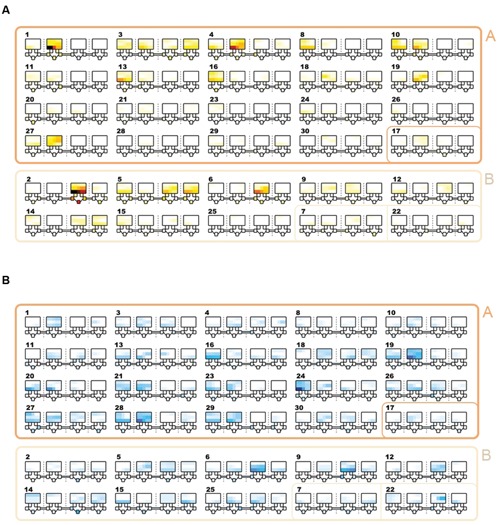
FIGURE 3.

Location and frequency of agonistic interactions by subject. Schematics showing the frequency of aggressive contests that occurred in each vivarium. The largest squares refer to the top section of each of the four vivarium with each row representing the three shelves. Underneath each large square, five small squares represent the five nest-boxes in the bottom section of the vivarium. Tubes connecting vivaria 1-2, 2-3, and 3-4 are shown. Each number refers to the overall I&SI rank. IDs are ordered by community (A & A/other = rows 1-4; B & B/other = rows 5-6). Individuals in community A and B win and lose more frequently in vivaria 1&2 and vivaria 3&4, respectively. (A) Total frequency of wins. Colors range from white (0 fights won in location) through yellow and red to black. (B) Total frequency of losses. Colors range from white (0 fights lost in location) through light and dark blue.
