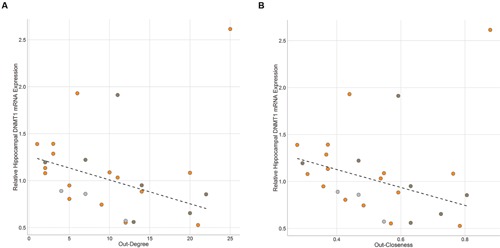
FIGURE 6.

Brain Gene Expression and Social Dominance. Hippocampal DNMT1 expression is negatively associated with (A) Out-Degree and (B) Out-Closeness. Black hashed lines represent best-fit with outlier removed. Each point represents one individual with color representing the network community of that individual (orange – community A, dark gray – community B, light gray – other).
