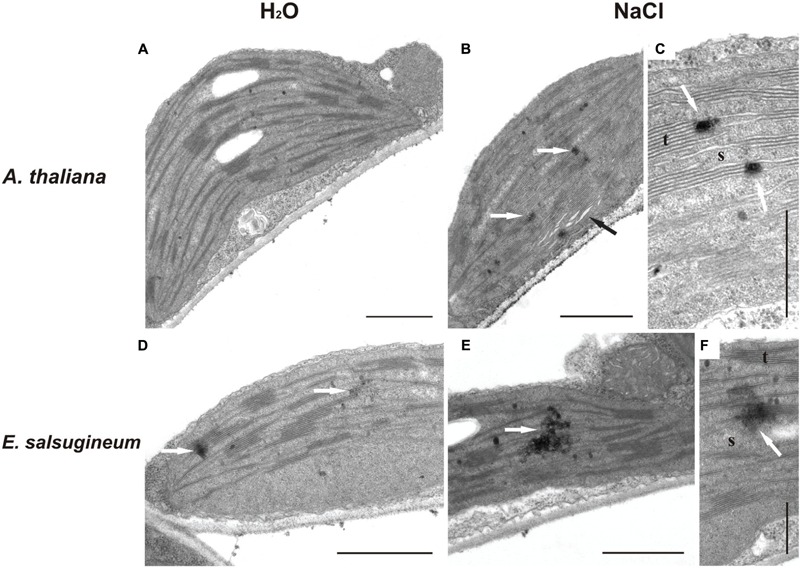
FIGURE 2.

Transmission electron microscopy (TEM) images of H2O2 accumulation in chloroplasts of A. thaliana and E. salsugineum plants treated with water and NaCl solution (0.15 and 0.3 M, respectively). The black spots (white arrows) represent H2O2 forming electron-dense cerium perhydroxide precipitates. A. thaliana chloroplasts from water-treated (A) and salt-stressed plants (B,C). Black arrow in (B) points to the swelling of thylakoids. E. salsugineum chloroplasts from water-treated (D) and salt-stressed plants (E,F). t, thylakoids; s, stroma. Bars = 1 μm (A,B,D,E); Bars = 0.5 μm (C,F).
