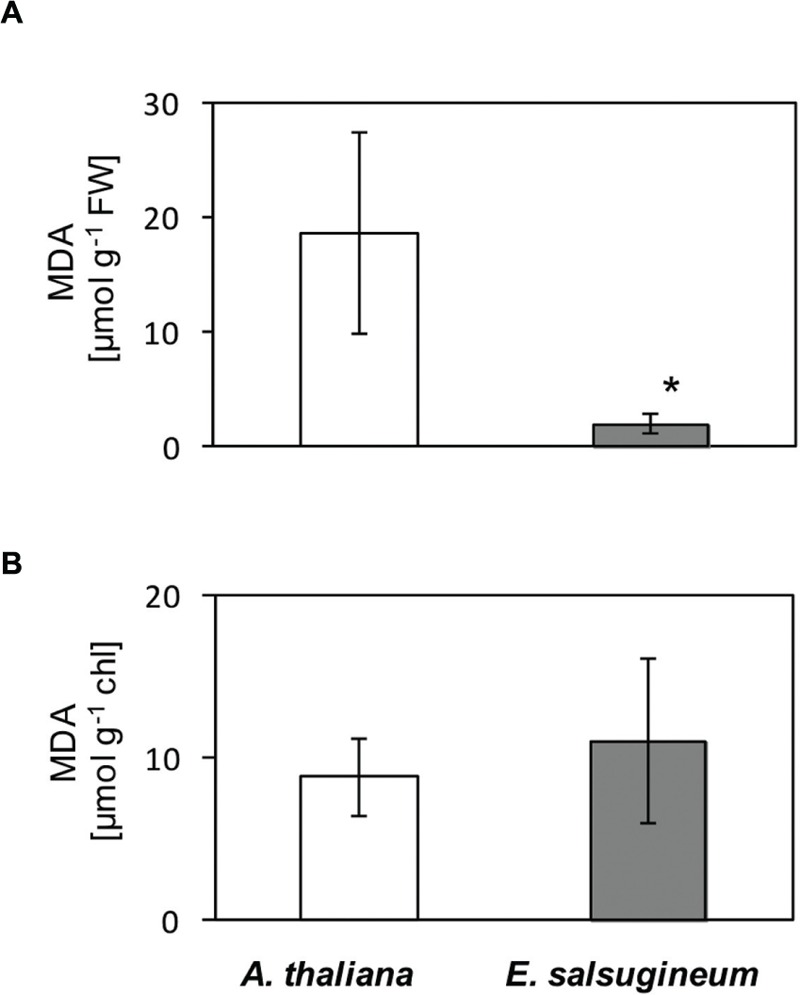
FIGURE 4.

Content of malondialdehyde (MDA) in leaves of water-treated A. thaliana and E. salsugineum plants (A) and isolated thylakoid membranes (TMs; B) assessed by high-performance liquid chromatography (HPLC). Each data point represents the mean ± SD (n = 3). ‘Asterisk’ indicates significant difference from A. thaliana.
