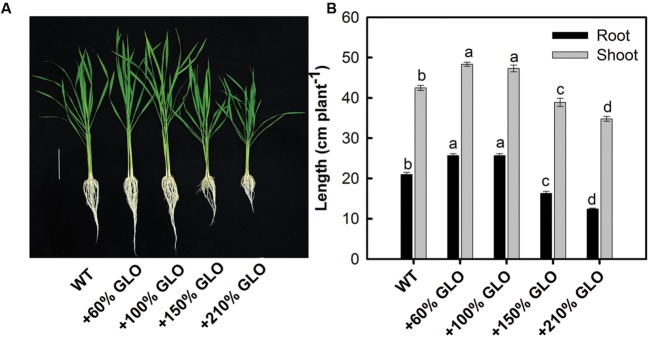
FIGURE 2.
Growth phenotypes of the GLO overexpression lines. The plants were grown as described in Figure 1. (A) The picture was taken, and (B) growth of shoot and root was measured when the plants were grown to six-leaf stage. Bar in (A) = 10 cm. The other legends are the same as those in Figure 1.

