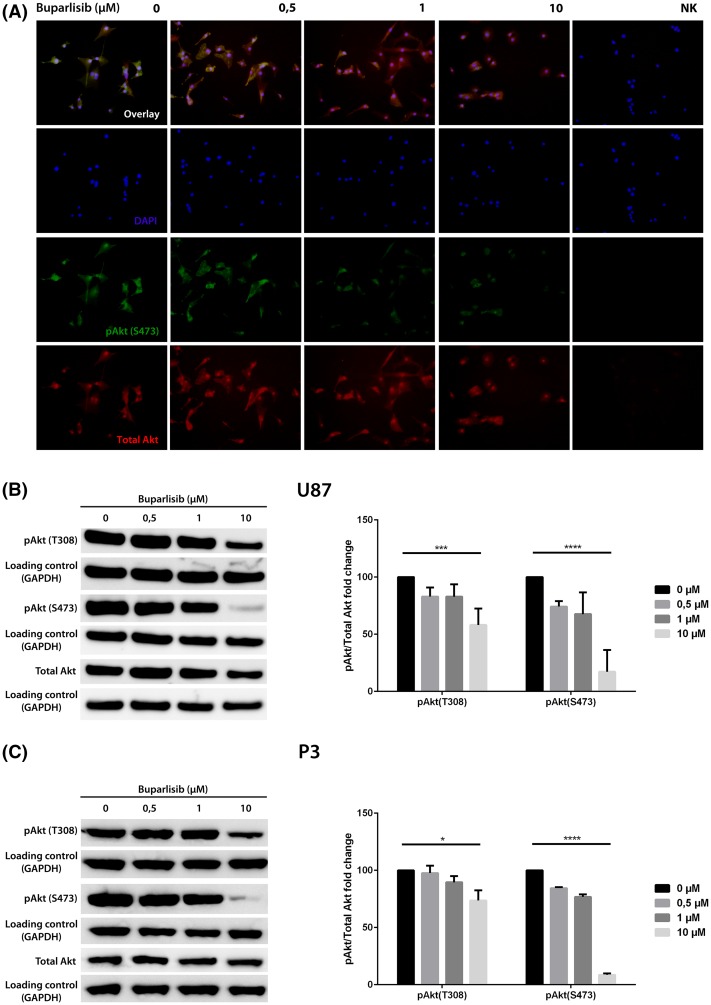
Fig. 2.
a Immunocytochemistry showing Akt phosphorylation in U87-cells at S473 after exposure to different concentrations of buparlisib for 72 h. Upper panel overlay image of Akt phosphorylated at site S473 (FITC, green) and total Akt (AP555, red) with DAPI nuclear counterstaining (blue). Middle panel 1 DAPI nuclear staining (blue). Middle panel 2 Akt phosphorylated at site S473 (FITC, green). Lower panel total Akt-levels (AP555, red). b Left western blots showing levels of pAkt (T308), pAkt (S473) and total Akt in U87 cells exposed to buparlisib for 72 h. Right densitometric assessment of western blots, showing relative changes in phosphorylation. c Left western blots showing levels of pAkt (T308), pAkt (S473) and total Akt in P3 cells exposed to buparlisib for 72 h. Right densitometric assessment of western blots, showing relative changes in phosphorylation. Error bars represent SEM of three independent experiments. p values estimated represent linear trends. *p < 0.05, **p < 0.01, ***p < 0.001, ****p < 0.0001

