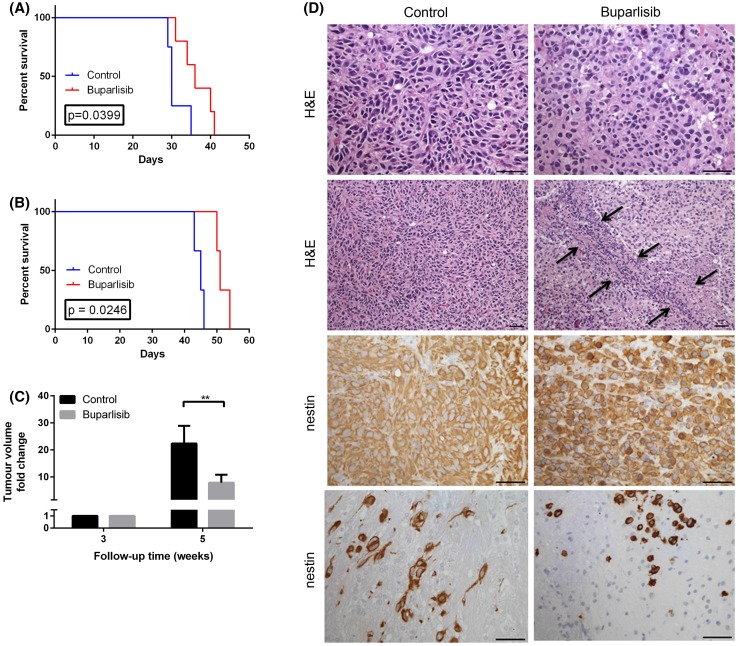
Fig. 3.
a Kaplan–Meyer survival curve for first study with nude rats carrying P3 xenografts (n = 9). b Kaplan–Meyer survival curve for the second study, with nude rats carrying P3 xenografts (n = 6). c MRI-based assessments of tumour volumes 3 weeks post implantation (treatment start) and 5 weeks post implantation. *p < 0.05. d H&E and nestin immunostained sections of treated and control tumors. Arrows indicate a necrotic tumour area. Scale bars 50 μm

