Figure 6.
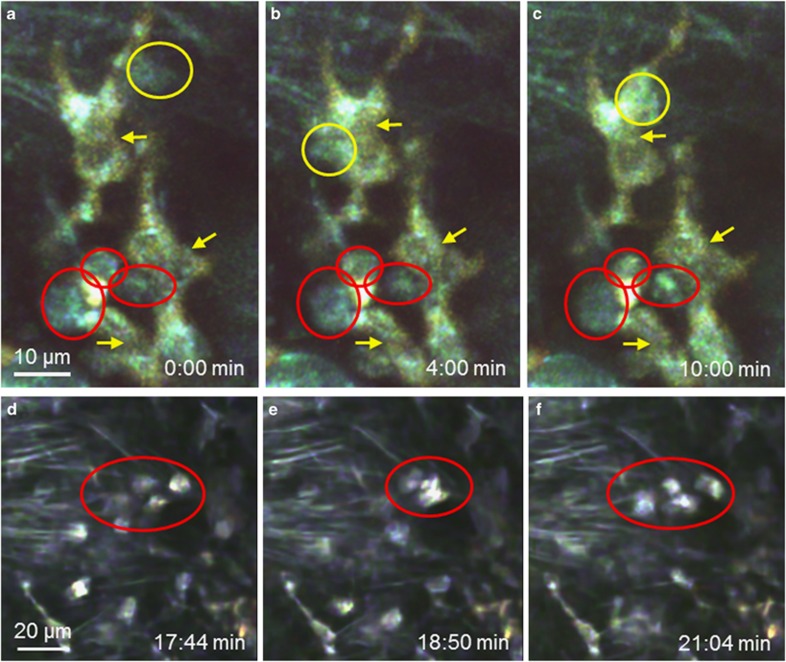
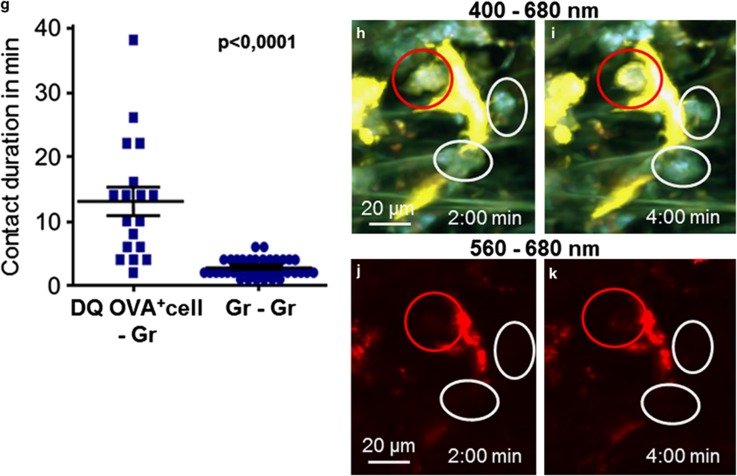
Dynamics of granulocytes and antigen-uptaking cells during an acute airway inflammation. (a–c) Time series of a projection of four focal planes. Contacts between granulocytes (red and yellow circles) and antigen-uptaking cells (stained with DQ OVA, yellow and yellow arrows) could be observed (Supplementary Movie 12). (d–f) Time series of a projection of eight focal planes. Contacts between two or more granulocytes (Supplementary Movie 13). (g) Quantification of the duration of contacts between granulocytes and antigen-uptaking cells (DQ OVA+ cell–Gr) or between granulocytes (Gr–Gr), significance was tested with Mann–Whitney U-test. (h–k) Antigen-uptaking cells (stained with DQ OVA, yellow in (h–i) and red in (j and k)) were contacted by neutrophils (Gr-1-immunoreactive, red circle, yellow in (h and i) and not stained in (j and k)) and eosinophils (Gr-1-negative, white circles).


