Figure 3.
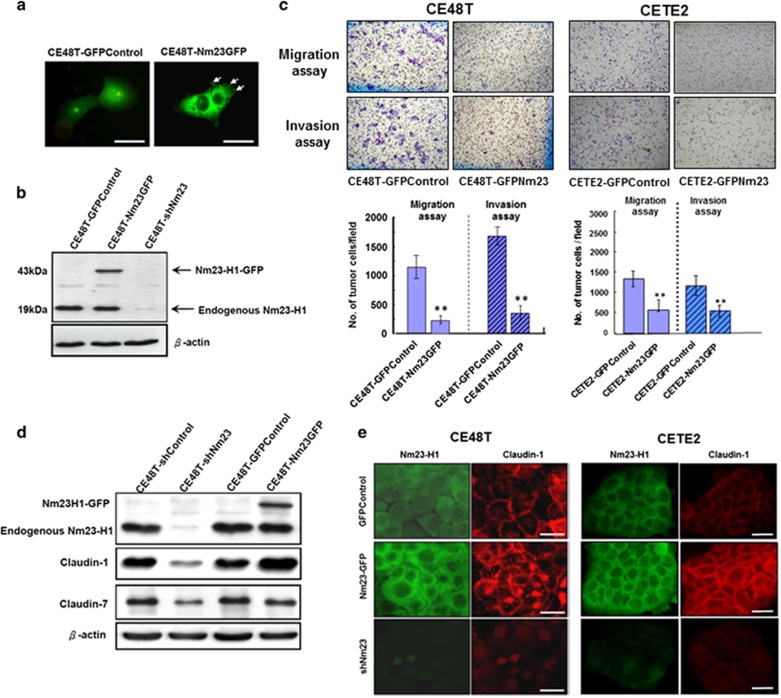
Overexpression of Nm23H1 suppresses cell migration, invasion and increases CLDN1 expression of ESCC cells. (a) The CE48T cells were transiently transfected with either GFP plasmids (control) or Nm23H1-GFP plasmids. High magnifications showed a diffuse cytosolic GFP signal in the GFP vector-transfected cells, whereas the Nm23H1-GFP signal can be clearly visualized at the cytoplasm area as well as in the cell trailing edge (arrows). Scale bar, 20 μm. (b) The CE48T cells were transiently transfected with the expression plasmids of GFP-vector (GFPControl), Nm23H1-GFP (Nm23GFP) and Nm23-shRNA (shNm23). Expression of Nm23H1 was detected at the predicted molecular mass of 43 kDa (Nm23H1-GFP) or 19 kDa (endogenous Nm23H1). (c) Representative photos of migration and invasion assays of the ESCC-GFPControl and the ESCC-Nm23GFP cells. Original magnification, × 100. The bar graphs presented the mean values obtained from three independent determinations (**P<0.01). (d) Western blot analysis for Nm23H1, CLDN1, CLDN7 and β-actin in the shRNA-control, the Nm23H1-silencing, the GFP-control and the Nm23H1-GFP clones of the CE48T cells. (e) High magnifications showed the expression and localization of Nm23H1 (green) and CLDN1 (red) in the ESCC-GFPControl, the ESCC-Nm23GFP and the Nm23H1-silencing cells. Scale bar, 20 μm.

