Figure 5.
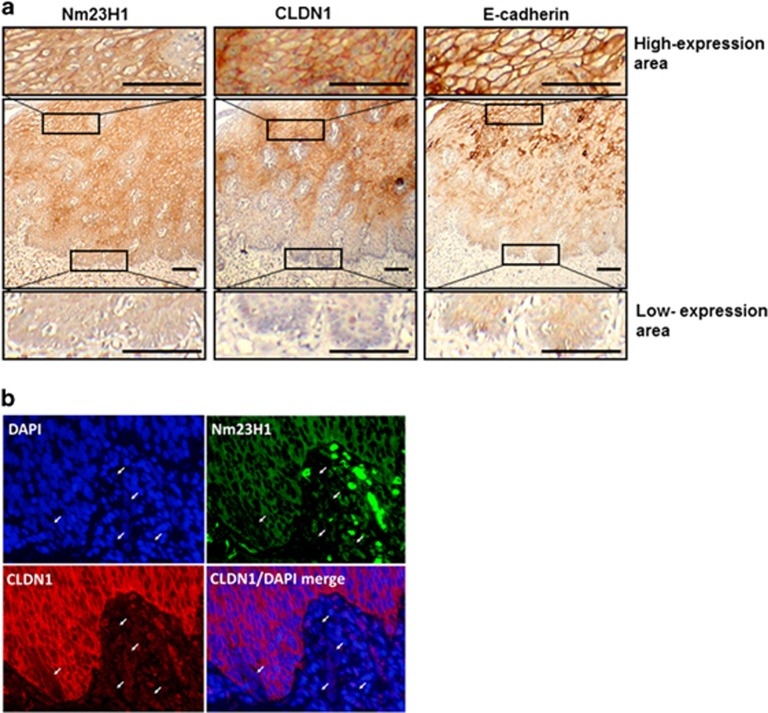
Expression levels of Nm23H1 at the invasive front of the ESCC tumor. (a) IHC analysis of expression patterns of Nm23H1, CLDN1 and E-cadherin in sequenced sections was shown. Representative images showed the reduced expression of Nm23H1, CLDN1 and E-cadherin at the invasive front of the ESCC tumor (lower panels) and high expression levels of Nm23H1, CLDN1 and E-cadherin in the main body of ESCC tumor (upper panels). Scale bar, 200 μm. (b) Representative double immunofluorescent images showed that several single ESCC cells appeared with losing or reducing Nm23H1 (green) and CLDN1 (red) expression (arrows), respectively. Nuclear DNA was stained with DAPI (blue). Scale bar, 20 μm.

