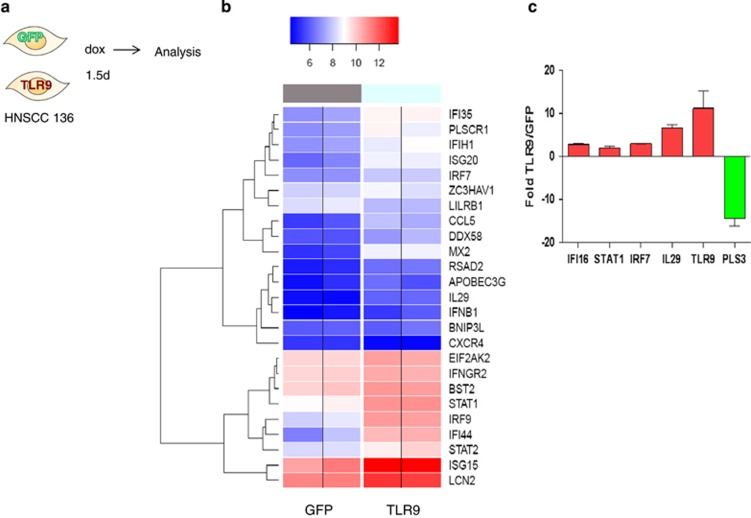
Figure 5.
Transcriptome changes induced by TLR9 re-expression. (a) Schematic representation of the experiment. HNSCC 136 PLVUT'-GFP and HNSCC 136 PLVUT'-TLR9 were induced for 36 h with doxycycline. The mRNA was extracted and analyzed by microarray. (b) 'the true log2 of the quantile normalized expression signals in four samples belonging to two groups, GFP & TLR9 (No ratio and no scaling). In order to enhance data reading, color separation (blue=low and red=high) was based on the 50th theoretical percentile of the expression matrix range' (c) cDNA from HNSCC 136 PLVUT'-GFP and HNSCC 136 PLVUT'-TLR9 induced for 36 h was subjected to qPCR to determine the level of expression of IFI16, STAT1, IRF7, IL-29, TLR9 and PLS3. The ratio of expression TLR9 divided by GFP was calculated and plotted on the chart. Data have been disposed on the GEO: number being generated.

