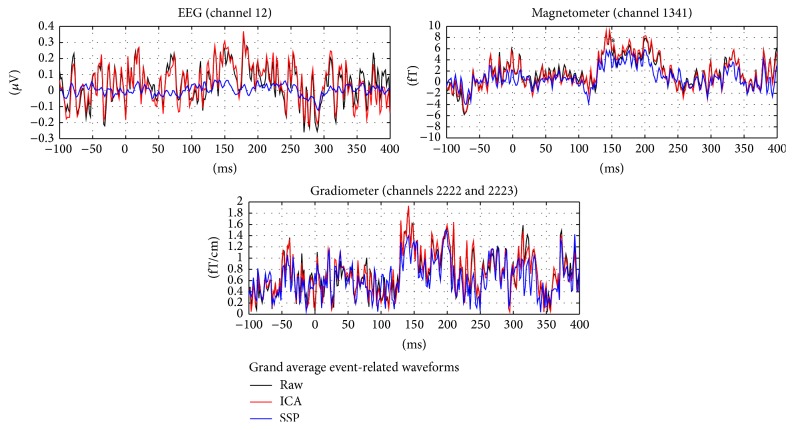
Figure 3.
Grand average event-related waveforms. Showing the channels with the signal peak amplitude among the EEG channels, magnetometers, and gradiometers, without any artifact correction (black) and after artifact correction based on Independent Component Analysis (ICA) (red) and Signal Space Projection (SSP) (blue).

