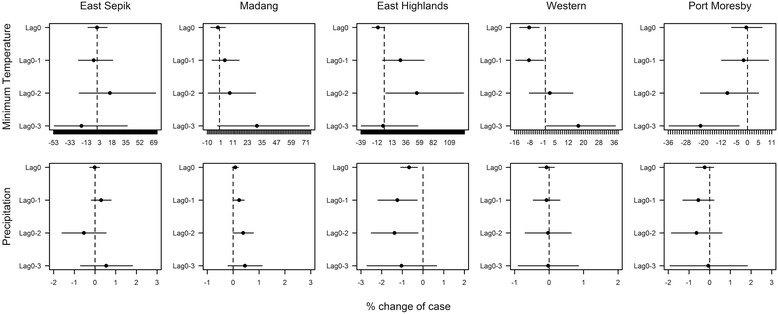
Fig. 2.

The percentage change of malaria cases with 1 °C temperature and 10 mm precipitation increment. The graphs show the effects of temperature and precipitation at different lag times on malaria cases in the five study locations. The effects are indicated by the percentage changes of the number of malaria cases with 1 °C minimum temperature and 10 mm precipitation increase. The dots and bars are the estimates and 95 % confidence intervals of the percent change
