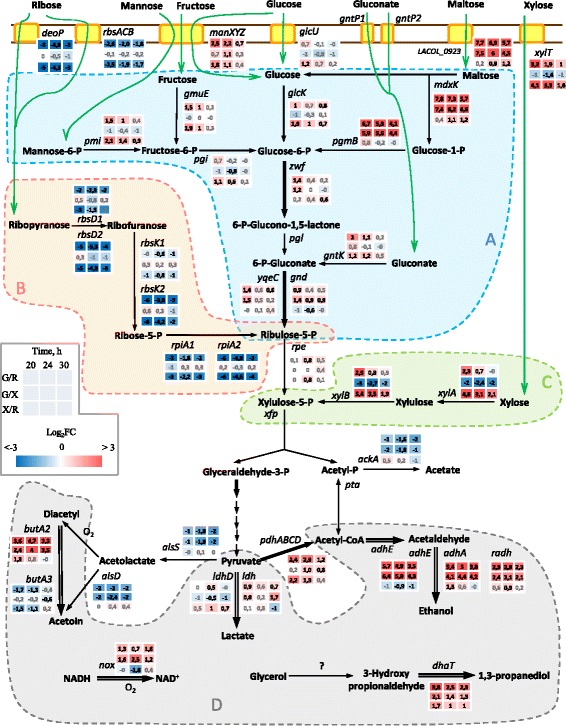
Fig. 4.

Differential expression of the genes involved in carbohydrate transport/catabolism, fermentation and NAD(P)H re-oxidation. Colored areas: blue (a) catabolism of hexoses and maltose, pink (b) ribose catabolism, green (c) xylose catabolism, grey (d) NAD(P)H re-oxidation. Bold arrows indicate NAD(P)H-producing reactions, white arrows – NAD(P)H-re-oxidizing reactions, yellow boxes represent transporters and green arrows – transport across the cell membrane. Notation ‘G/R’ means the ratio of normalized read counts between glucose and ribose samples. The 3 × 3 matrices for each enzyme/transporter gene contain values log2FC for pairwise comparisons between three transcriptomes for three time points, as indicated in the legend. The log2FC values are shown in black if the change was statistically significant (adjusted p-value < = 0.05) and in gray if it was not statistically significant
