
Fig. 1.
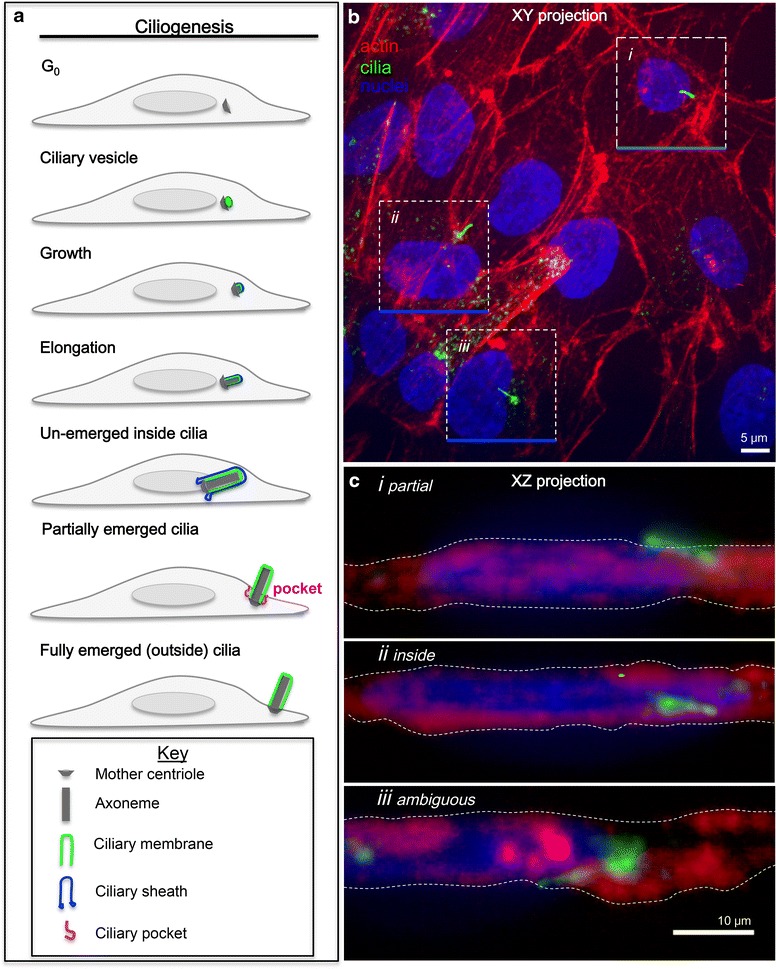
Current ciliogenesis assays are ambiguous. a Ciliogenesis model based on Sorokin’s EM data [16–18]. b XY projection of htert-RPE1 cells stably expressing pH Smo (green) after serum starvation for 48 h and staining for actin (red, Alexa Fluor 568 phalloidin) and nuclei (blue, Hoechst dye), imaged by SDCM. c XZ projections from indicated boxed areas in b. Projection is of multiple z-axis images along the blue line. Dashed lines in c indicate cell outline