
Fig. 2.
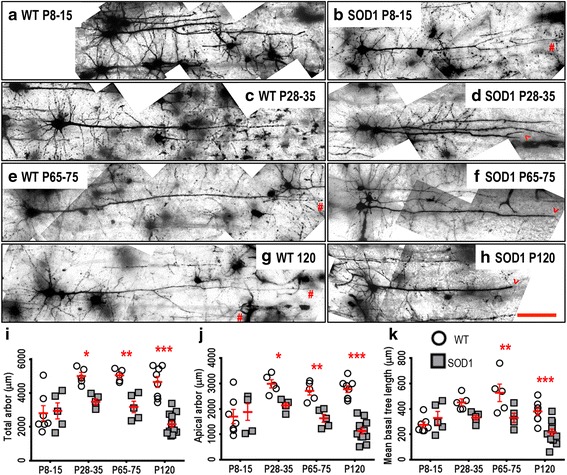
Decreased dendritic arbors of SOD1 LVPNs within the motor cortex commenced from P28-35, compared to WT controls. Images show mosaics of motor cortex LVPNs from P8-15, P28-35, P65-75 and P120 WT (a, c, e, g) and SOD1 (b, d, f, h) mice. The red hashes indicate regularly tapering apical dendrites, while the arrowheads indicate pathologic abrupt endings in SOD1 apical dendrites. i is a scatterplot quantifying significantly decreased total dendritic arbor length (μm) of SOD1 LVPNs (grey squared) compared to WT controls (white circles) at P28-35, P65-75 and P120. j is a scatterplot quantifying significantly decreased apical arbor length (μm) of SOD1 LVPNs (grey squared) compared to WT controls (white circles) at P28-35, P65-75 and P120. k is a scatterplot quantifying significantly decreased mean basal tree length (μm) of SOD1 LVPNs (grey squared) compared to WT controls (white circles) at P65-75 and P120. All data are mean ± SEM, with two-way ANOVAs followed by Bonferroni post-tests, *P < 0.05, **P < 0.01 and ***P < 0.001; n = 7, 5, 5 and 8 for WT P8-15, P28-35, P65-75 and P120 respectively; n = 6, 5, 5 and 12 for SOD1 P8-15, P28-35, P65-75 and P120 respectively. Scale bar: 100 μm