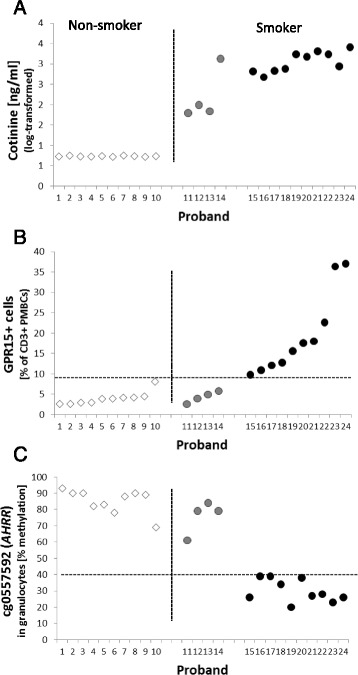
Fig. 3.

Cellular biomarkers associated with tobacco smoking. Subjects were separated into non-smoker (white diamond), occasional smoker (gray circle), and smoker (black circle) by both a questionnaire and cotinine level in the blood (a). Separately, the content of GPR15+ CD3+ T cells in blood (b) and the degree of methylation at the CpG site cg05575921 within AHRR in granulocytes (c) perfectly indicate the systemic effect of active tobacco smoking on blood cell types
