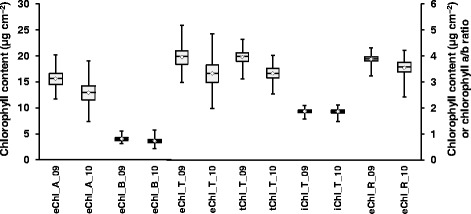
Fig. 1.

Box plot showing differences in chlorophyll a (eChl_A), total chlorophyll (eChl_T) and chlorophyll b (eChl_B) using the extract-based chlorophyll method and total chlorophyll using extractable chlorophyll method (eChl_T), wavelet transformed spectral reflectance chlorophyll method (tChl_T) and spectral reflectance index total chlorophyll method (iChl_T). Box edges represent the upper and lower quantile with median value shown as bold line in the middle of the box and mean values as white diamonds. Left scale represent the values for eChl_A, eChl_T and tChl_T. Right scale represents the values for eChl_R, eChl_B and iChl_T
