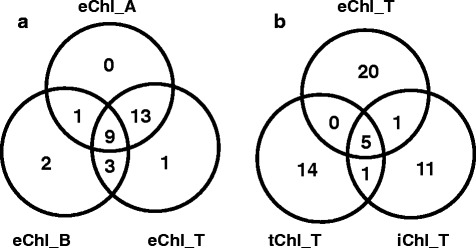
Fig. 4.

a Venn diagram showing the number of SNPs significantly associated with extractable chlorophyll a (eChl_A), chlorophyll b (eChl_B) and total chlorophyll (eChl_T). b Venn diagram showing the number of SNPs significantly associated with extractable total chlorophyll (eChl_T), wavelet transformed spectral reflectance total chlorophyll (tChl_T) and spectral reflectance index total chlorophyll (iChl_T)
